DeFI Coin Price Forecast – Expert Analysis & Trading Tips | Learn 2 Trade – Expert Analysis & Trading Tips | Learn 2 Trade – Expert Analysis & Trading Tips | Learn 2 Trade – Expert Analysis & Trading Tips | Learn 2 Trade – August 28
The DeFI Coin price forecast points out that the DeFI Coin is presently on an impulsive run up the price chart as buyers resume their buying spree. This resulted in the DEFC price breaking the upper demand zone, as it climbed back to the $0.07550 level.
DEFCUSD Long-Term Trend: Bullish (1-hour chart)
Significant Levels:
Supply zone: $0.07550, $0.06960
Demand zone: $0.07170, $0.06740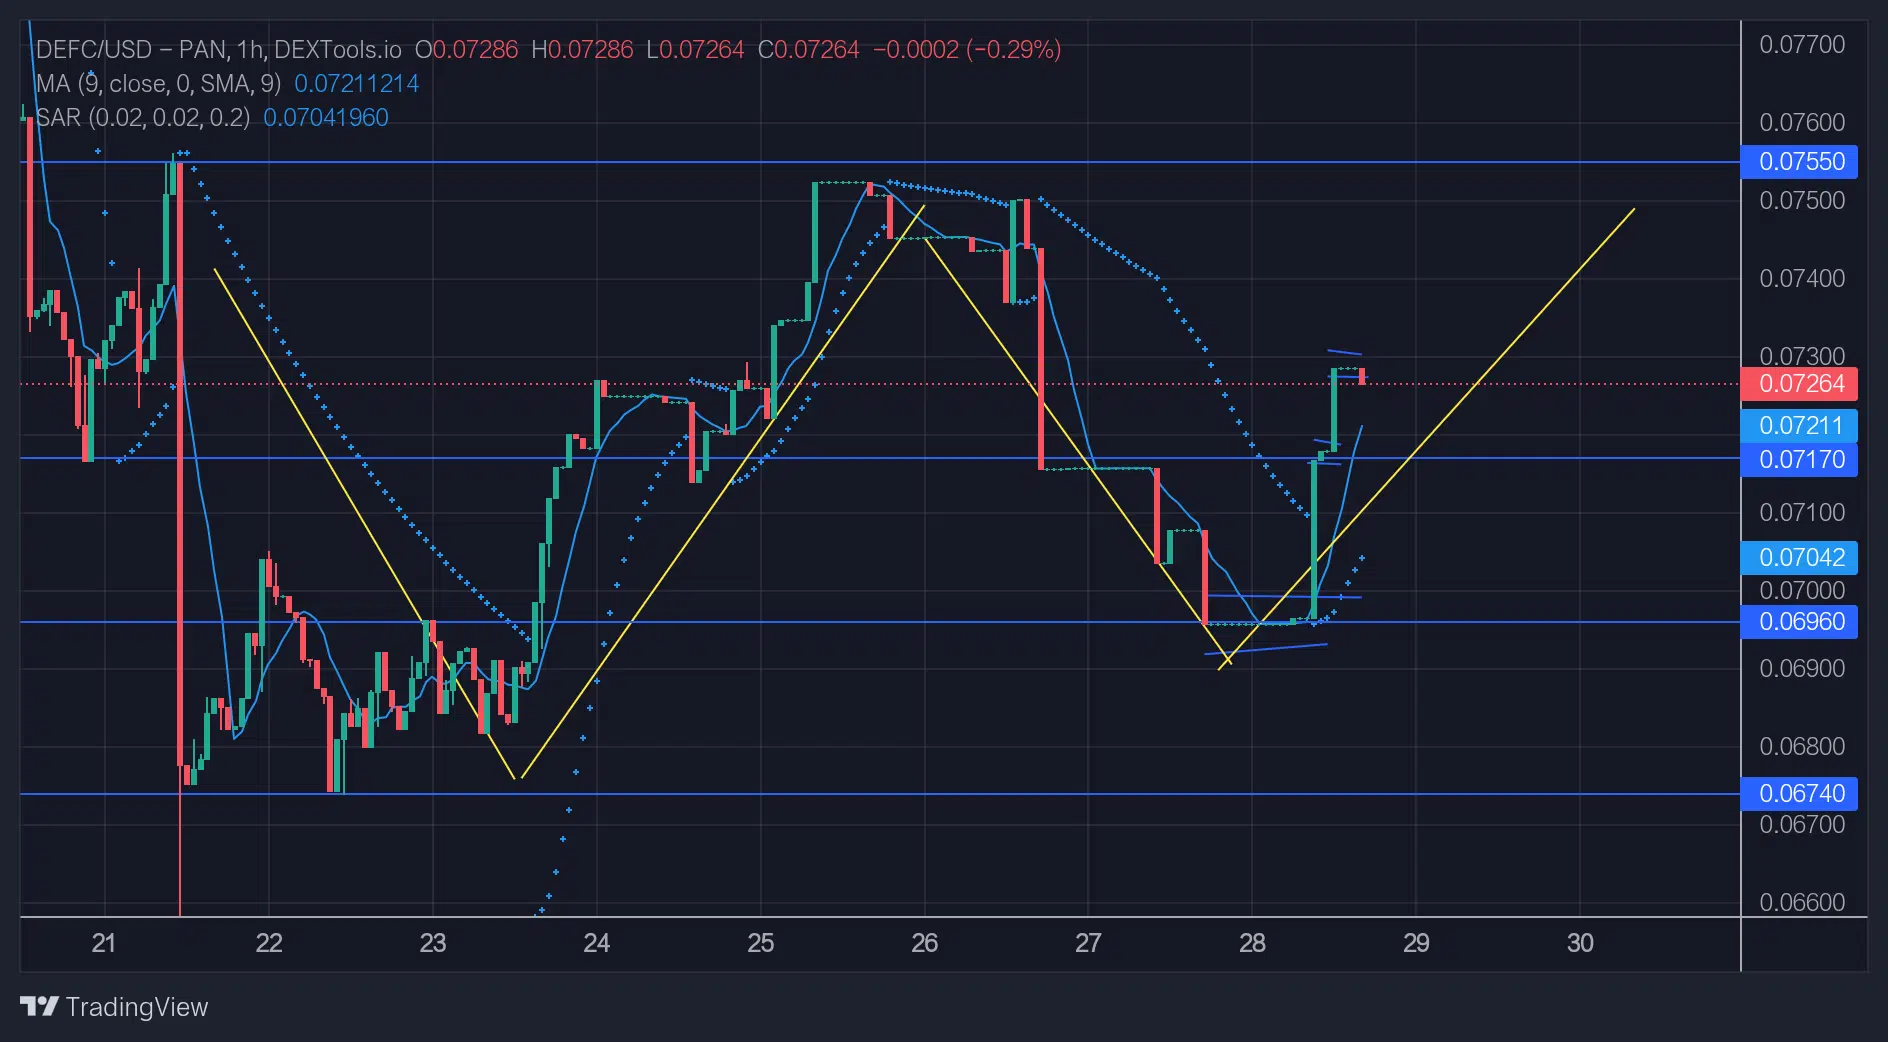
DeFI Coin Price Forecast – Expert Analysis & Trading Tips | Learn 2 Trade – Expert Analysis & Trading Tips | Learn 2 Trade – Expert Analysis & Trading Tips | Learn 2 Trade – Expert Analysis & Trading Tips | Learn 2 Trade: Market Outlook
The moving average (SMA) period nine (9) direction on the price chart indicates a high probability that the market will continue the bullish trend of the DeFC price.
A look back at the price chart from the 21st reveals the market is ascending with the formation of a higher low. The prices are ready to retrace to the upper resistance level at $0.07550.
After the market had reached the supply zone on the 22nd of the month, prices continued in an ascending triangle, and the recent correction that occurred on the 28th shows that the market has regained enough momentum to continue its rise back to $0.07550.
DEFC Medium-Term: Trend Bullish (15-minute chart)
The Parabolic SAR (Stop and Reverse) indicator on the chart indicates that the current price direction is following an uptrend. This is a confirmation of the uptrend pattern obvious in the DEFI coin’s price action.
You can purchase DeFi Coin here: Buy DEFC
Note: Learn2.trade is not a financial advisor. Do your research before investing your funds in any financial asset or presented product or event. We are not responsible for your investing results.
- Broker
- Min Deposit
- Score
- Visit Broker

- Award-winning Cryptocurrency trading platform
- $100 minimum deposit,
- FCA & Cysec regulated

- 20% welcome bonus of upto $10,000
- Minimum deposit $100
- Verify your account before the bonus is credited


- Fund Moneta Markets account with a minimum of $250
- Opt in using the form to claim your 50% deposit bonus