

Further price increase envisage
BNBUSD Price Analysis: 13 December
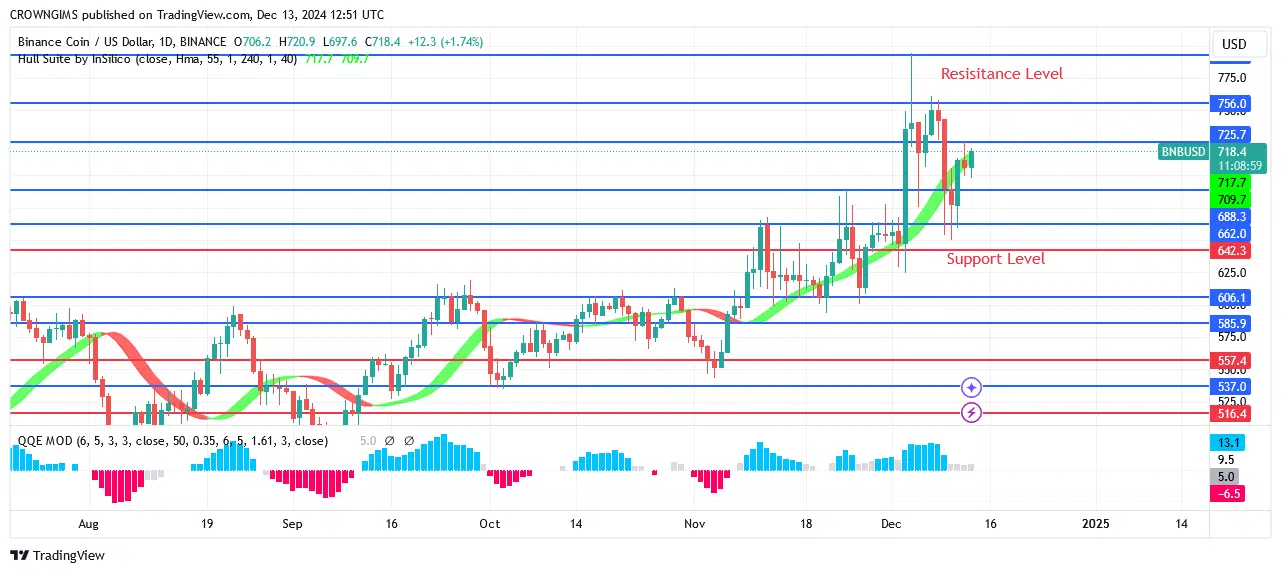
Buyers may be able to push the price to test the $756.0 and $792.6 resistance levels if they can hold onto the $689 support level and break above the $756.0 resistance level. BNB is expected to challenge the prior lows of $662.0 and $642.2 if it can overcome the critical $689.7 level.
BNB/USD Market
Key levels:
Supply levels: $726.3, $756.0, $792.6
Demand levels: $689.7, $662.0, $642.2
BNBUSD Long-term Trend: Bullish
The BNBUSD daily chart is showing positive action. A few weeks ago, the cryptocurrency’s price dropped from $689.7 to $642.2. The $662.0 level provided some resistance, but the bulls gained power and broke over it. The market was dominated by purchasing when BNB rose to $689.7 the week before. There were indications of a positive reversal at the anticipated support level. Contrary to the upward trend, the price’s recent reversal at $662.0 suggests that purchasers may be open to a higher offer. At the moment, the price is $726.3.
BNBUSD medium-term Trend: Bullish
The coin’s favorable effects can cause the price of BNBUSD to rise during the course of the following four hours. The BNB tested at $642.2 and then started to rise. This was communicated to us on November 14. The total amount paid was $662.0. The price surged above the predefined threshold due to the bulls’ fervor. Right now, $726.3 is the highest price.

Start using a world-class auto trading solution
You can purchase Lucky Block here. Buy LBLOCK


