
ကူးသန်းရောင်းဝယ်ရေးဝန်ဆောင်မှု။ ကျွန်ုပ်တို့၏ Algo သည် အရောင်းအ၀ယ်များကို အလိုအလျောက်ဖွင့်ပြီး ပိတ်ပါသည်။
L2T Algo သည် အန္တရာယ်အနည်းဆုံးဖြင့် အလွန်အမြတ်အစွန်းအချက်ပြမှုများကို ပေးသည်။
24/7 cryptocurrency ကုန်သွယ်မှု။ မင်းအိပ်နေတဲ့အချိန်မှာ ငါတို့က အရောင်းအဝယ်လုပ်တယ်။
အားသာချက်များစွာဖြင့် 10 မိနစ်တပ်ဆင်ခြင်း။ ဝယ်ယူမှုနှင့်အတူ လက်စွဲစာအုပ်ကို ပေးထားသည်။
79% အောင်မြင်မှုနှုန်း။ ကျွန်ုပ်တို့၏ရလဒ်များသည် သင့်ကို စိတ်လှုပ်ရှားစေမည်ဖြစ်သည်။
တစ်လလျှင် 70 ကုန်သွယ်မှုအထိ။ ရနိုင်သောအတွဲ ၅ တွဲကျော်ရှိသည်။
လစဉ်စာရင်းသွင်းမှုများသည် £58 မှစတင်သည်။
အဓိကခံနိုင်ရည်အဆင့်: $ 60, $ 62, $ 64
အဓိကပံ့ပိုးမှုအဆင့်များ: $ 40, $ 38, $ 36
Polkadot (DOT) စျေးနှုန်းရေရှည်လမ်းကြောင်း - Bearish
Polkadot ၏ (DOT) စျေးနှုန်း is in a downward move but it may resume upside momentum. The altcoin has declined to $22 low. Since January 17, the cryptocurrency has been in a downward move after the rejection at the $28 resistance. Today, the DOT price is retesting the current support at $22. The $22 support is the previous low of January 10, price fall. If the bears fail to break the $22 low, it is assumed that the downtrend is over. The upward move will resume if the support holds at $22. Besides, Polkadot has reached the oversold region of the market. The selling pressure is likely to reach bearish exhaustion.
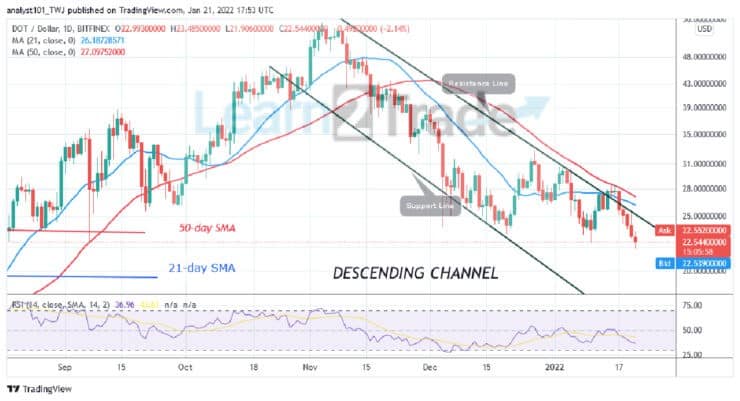
နေ့စဉ်ဇယားအညွှန်းကိန်းများဖတ်ရှုခြင်း -
The altcoin price is at level 36 of the Relative Strength Index for period 14. DOT price is approaching the oversold region of the market. The crypto’s price bars are below the moving averages which make it prone to fall. The 21-day SMA and the 50-day SMA are sloping sloping southward indicating the downtrend.
Polkadot (DOT) အလယ်အလတ်ကာလ Trend: Bullish
Polkadot has resumed downtrend as price breaks below the current support. Meanwhile, on January 19 downtrend; a retraced candle body tested the 78.6% Fibonacci retracement level. The retracement indicates that DOT price will fall to level 1.272 Fibonacci extensions or $22.40.
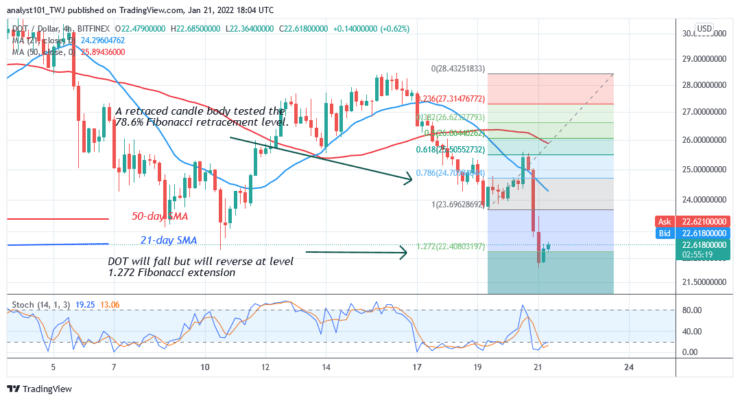
၄ နာရီဇယားကွက်အညွှန်းများဖတ်ခြင်း
Polkadot is below the 20% area of the daily stochastic. The market has reached the oversold region. Buyers are expected to emerge in the oversold region to push prices upward. The 21-day SMA and the 50-day SMA are sloping downward indicating the downtrend. The altcoin has a bearish crossover. That is, the 21-day SMA crosses below the 50-day SMA which indicates a sell order.
Polkadot အတွက်ယေဘူယျ Outlook (DOT)
Today, DOT/USD has declined further to $22 low but it may resume upside momentum. It appears the market has fallen to the oversold region. The Fibonacci tool has indicated that the altcoin can possible reverse at level $22.
ဤနေရာတွင် crypto ဒင်္ဂါးများကို ၀ ယ်နိုင်သည်။ ဒင်္ဂါးပြားဝယ်ပါ
မှတ်စု: Learn2Trade.com သည်ငွေကြေးဆိုင်ရာအကြံပေးတစ် ဦး မဟုတ်ပါ။ မည်သည့်ဘဏ္assetာရေးပိုင်ဆိုင်မှုသို့မဟုတ်တင်ပြထုတ်ကုန်သို့မဟုတ်ဖြစ်ရပ်၌သင်တို့၏ရန်ပုံငွေများရင်းနှီးမြှုပ်နှံမတိုင်မီသင်၏သုတေသနလုပ်ပါ။ သင်၏ရင်းနှီးမြှုပ်နှံမှုရလဒ်များအတွက်ကျွန်ုပ်တို့တာ ၀ န်မရှိပါ
- ပှဲစား
- min သိုက်
- နိုင်ပြီ
- ပွဲစားသို့လည်ပတ်ပါ

- ဆုရ Cryptocurrency ကုန်သွယ်ပလက်ဖောင်း
- အနည်းဆုံးဒေါ်လာ ၁၀၀
- FCA & Cysec စည်းမျဉ်းသတ်မှတ်

- ဒေါ်လာ ၂၀၀၀ အထိ ၂၀% ကြိုဆိုသည့်အပိုဆုကြေး
- အနည်းဆုံးအပ်ငွေဒေါ်လာ ၁၀၀
- ဘောနပ်စ်မထည့်သွင်းခင်သင့်အကောင့်ကိုစစ်ဆေးပါ

- 100 ကျော်ကွဲပြားခြားနားသောဘဏ္financialာရေးထုတ်ကုန်
- အနည်းဆုံး $ 10 မှရင်းနှီးမြှုပ်နှံ
- တူညီသောနေ့မှဆုတ်ခွာနိုင်သည်
- အနည်းဆုံးဒေါ်လာ ၅၀၀ ဖြင့် Moneta Markets အကောင့်ကိုရန်ပုံငွေထည့်ပါ
- သင်၏ ၅၀% အပ်ငွေအပိုဆုကြေးတောင်းခံရန်ပုံစံကိုအသုံးပြုပါ