
Prekybos kopijavimo paslauga. Mūsų Algo automatiškai atidaro ir uždaro sandorius.
L2T Algo teikia labai pelningus signalus su minimalia rizika.
24/7 prekyba kriptovaliutomis. Kol jūs miegate, mes prekiaujame.
10 minučių sąranka su dideliais pranašumais. Instrukcija pateikiama kartu su pirkiniu.
79% sėkmės rodiklis. Mūsų rezultatai jus sužavės.
Iki 70 sandorių per mėnesį. Yra daugiau nei 5 poros.
Mėnesio abonementai prasideda nuo 58 GBP.
Pasipriešinimo lygiai: $ 60, $ 62, $ 64
Pagrindiniai palaikymo lygiai: 40 USD, 38 USD, 36 USD
„Polkadot“ (DOT) kainos ilgalaikė tendencija: Uparty
Polkadot (DOT) yra in an upward correction as price breaks above the moving average lines with a potential hold above $6.43. The upward move was repelled at the high of $6.83. Today, the DOT price is retracing above the moving average lines. On the downside, if price breaks below the 50-day line SMA, the selling pressure will resume. The altcoin will fall and be confined between the moving average lines. Polkadot will trend when the moving average lines cross. For instance, DOT price would revisit the prior low at the $5.73 and $5.65 price levels if the bears’ breach below the 21-day line SMA. Conversely, if the DOT price retraces and holds above the moving average line, the upward move may resume.
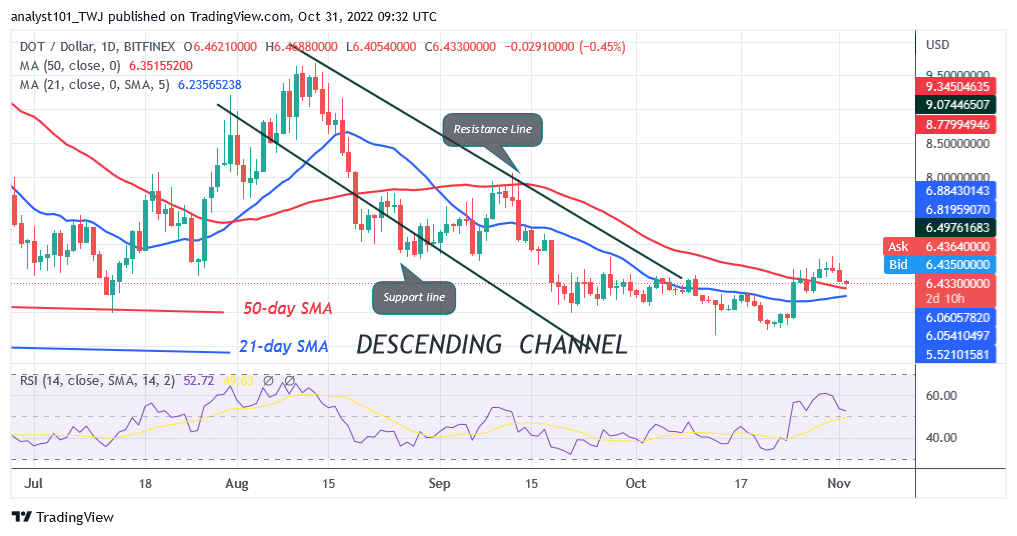
Dienos diagramos rodiklių skaitymas:
For period 14, the DOT price is at level 52 of the Relative Strength Index. As it surges to the prior highs, the altcoin is in the bullish trend zone. If the price bars are above the moving average lines, the DOT price may increase once more. The downward-sloping direction of the moving average lines indicate a decline.
„Polkadot“ (DOT) vidutinės trukmės tendencija: „Bearish“
On the 4-hour Chart, the DOT price has broken below the moving average lines as it faces rejection at the recent high. Meanwhile, on October 31 downtrend; DOT price corrected upward and a candle body tested the 61.8 %Fibonacci retracement level. The correction implies that DOT will fall to level 1.618 Fibonacci extension or $6.43.
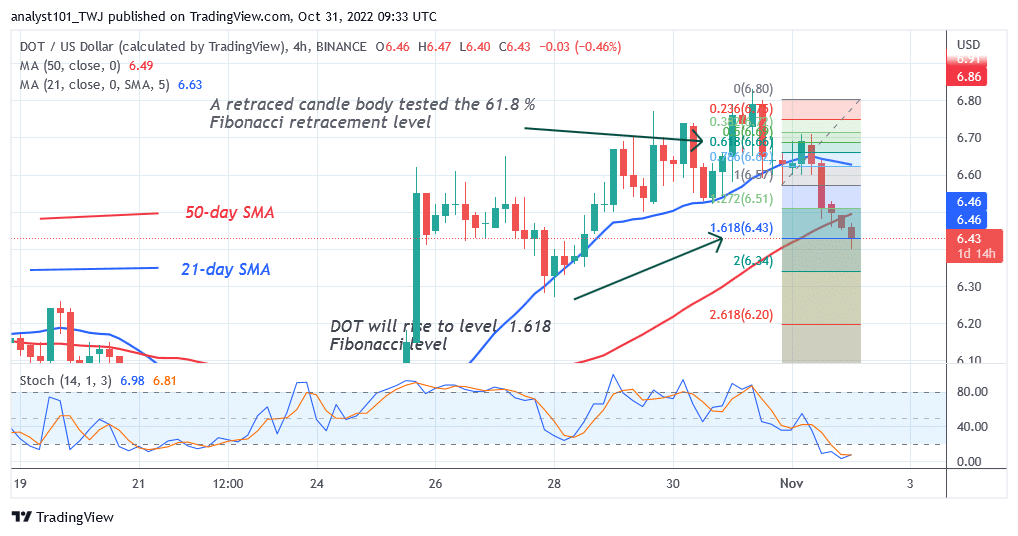
4 valandų diagrama Diagramos Rodiklių skaitymas
Below the daily stochastic’s 20% band, DOT has a negative momentum. The oversold area of the market is where the cryptocurrency has sunk. Bearish weariness has been achieved with the selling pressure. The rising slope of the moving average lines indicate an uptrend, which corresponds to the prior trend.
Bendroji „Polkadot“ (DOT) perspektyva
While Polkadot is on an upward correction, the moving average lines have been breached with a potential hold above $6.43. The $6.83 high is where the upswing is being rejected. Possible retracement of the coin above the moving average lines.
Kripto monetas galite įsigyti čia. Pirkite LBLOCK
Pastaba: „Learn2.Trade“ nėra finansų patarėjas. Atlikite tyrimus prieš investuodami savo lėšas į bet kokį finansinį turtą, pristatytą produktą ar įvykį. Mes neatsakome už jūsų investavimą
- Tarpininkas
- Minimalus depozitas
- Balas
- Apsilankykite tarpininke

- Apdovanojimus pelniusi kriptovaliutų prekybos platforma
- Minimalus 100 USD indėlis,
- FCA ir „Cysec“ reguliuojami

- 20% priėmimo premija iki 10,000 XNUMX USD
- Minimalus indėlis $ 100
- Prieš įskaitydami premiją, patikrinkite savo sąskaitą

- Daugiau nei 100 skirtingų finansinių produktų
- Investuokite nuo vos 10 USD
- Galima pasitraukti iš tos pačios dienos
- Fondo „Moneta Markets“ sąskaita, turinti mažiausiai 250 USD
- Norėdami pasinaudoti 50% indėlio premija, pasirinkite formą