
Isevisi yokuhweba ngamakhophi. I-Algo yethu ivula futhi ivale ngokuzenzakalelayo ukuhweba.
I-L2T Algo inikeza amasiginali anenzuzo enkulu anengozi encane.
24/7 ukuhweba nge-cryptocurrency. Ngenkathi ulele, siyahweba.
Ukusethwa kwemizuzu eyi-10 okunezinzuzo ezinkulu. Imanuwali inikezwe ngokuthenga.
79% Izinga lempumelelo. Imiphumela yethu izokujabulisa.
Ukuhwebelana okungafika kuma-70 ngenyanga. Kunamapheya angaphezu kwama-5 atholakalayo.
Okubhaliselwe kwanyanga zonke kuqala ku-£58.
Ukuhlaziywa Kwenani le-NEO - Okthoba 05
NEO is approaching a potential bullish reversal zone; the rejection of the price at the $16 support level may be a price reversal towards the resistance level of $19, $22, and $25. In case the support level of $16 does not hold, the price may reduce to $14 and $12 support level.
Imakethe ye-NEO / USD
Amazinga wokhiye:
Amazinga okumelana nawo: $ 19, $ 22, $ 25
Amanqanaba wokusekela: $ 16, $ 14, $ 12
I-NEO / USD Trend Yesikhathi Eside - Bearish
The bears maintain their pressure in the NEO/USD market. The price is obeying the command of the chart pattern formed last week (Head and Shoulder pattern). The former support level of $19 has turned to a resistance level after the breaking of the level by the bears’ pressure. Yesterday, NEO pulled back and gain 1.2%.
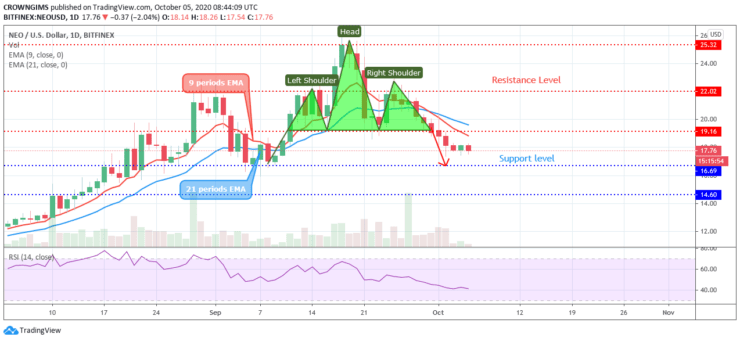
Today, the crypto is continuing its bearish movement targeting the support level of $16. The 21 periods EMA remains above the 9 periods EMA while the price is trading below the later EMA; an indication of bearish momentum. NEO is approaching a potential bullish reversal zone; the rejection of the price at the $16 support level may be a price reversal towards the resistance level of $19, $22, and $25. In case the support level of $16 does not hold, the price may reduce to $14 and $12 support level.
I-NEO/USD I-Medium-term Trend – bearish
The sellers dominate the NEO market in the 4-hour chart. That means NEO/USD is under the bearish momentum. Further price reduction is envisaged as the $19 price level has been penetrated downside and it is moving down towards the $16 demand level.
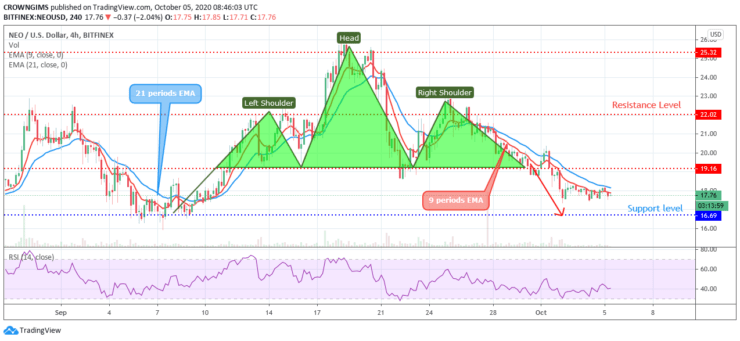
The two EMAs are at distance to each other and the price is trading below the 9 periods EMA and 21 periods EMA as a sign of an increase in the bears’ momentum. The Relative Strength Index (14) on the 4-hour chart is at 40-level bending down which reveals that the bears may continue to hold the market. The price may reduce to the demand level at $16.
- broker
- Min Deposit
- Umphumela
- Vakashela Broker

- Ipulatifomu yokuhweba ye-Cryptocurrency ewina umklomelo
- $ 100 idiphozi encane,
- I-FCA ne-Cysec kulawulwa

- 20% wamukelekile ibhonasi efinyelela ku- $ 10,000
- Idiphozi encane $ 100
- Qinisekisa i-akhawunti yakho ngaphambi kokufakwa kwebhonasi

- Imikhiqizo yezimali eyehlukene engaphezu kwe-100
- Faka imali kusuka ku- $ 10 okuncane
- Ukuhoxiswa kosuku olufanayo kungenzeka
- Izindleko Zokuhweba Eziphansi Kakhulu
- I-50% Ibhonasi Yemukeli
- Ukusekelwa kwamahora angama-24 okuwinile
- I-akhawunti Yezimakethe Zemali Yezimali enenani eliphansi lama- $ 250
- Khetha ukusebenzisa ifomu ukufaka isicelo sakho sebhonasi engu-50%