
關鍵阻力位: 0.7000,0.7200,0.7400
關鍵支持級別: 0.6200,0.6000,0.5800
NZD / USD價格長期趨勢:看跌
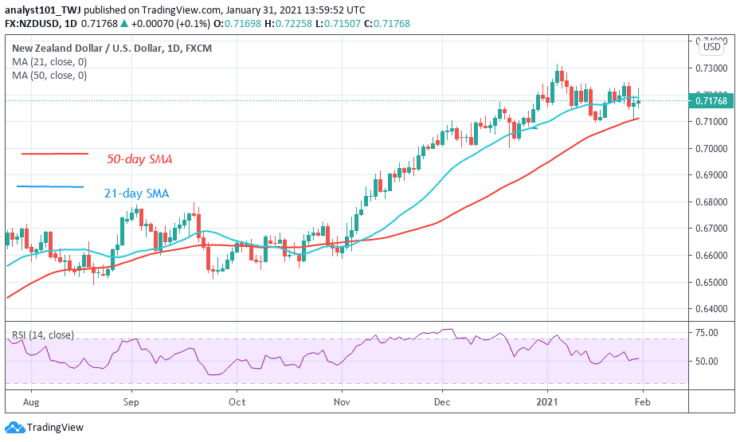
The Kiwi is intact as the pair rebounds above level 0.7100. Since January 27, the price has been falling after rejection from level 0.7250. The downtrend is likely to end if level 0.7150 support holds. The long candlestick tail indicates that there strong buying pressure above level 0.7100.
每日圖表指標閱讀:
Kiwi has risen to level 53 of the Relative Strength Index period 14. It indicates that the pair has enough room to rally on the upside. The 50-day SMA and 21-day SMA are sloping upwardly indicating the uptrend.
紐元/美元中期趨勢:看跌
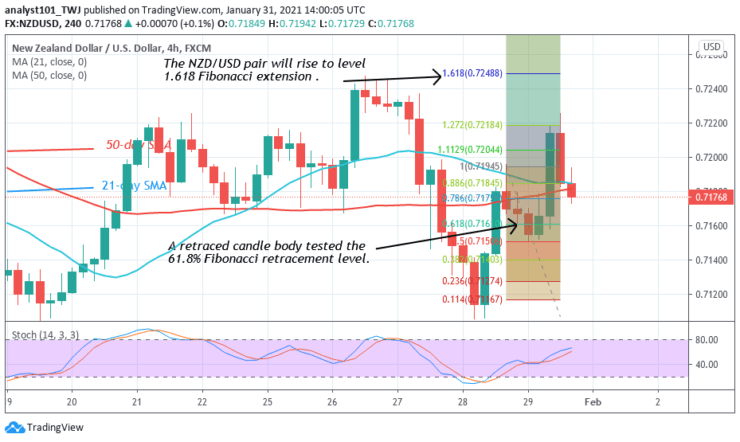
On the 4-hour chart, the NZD/USD pair is in an uptrend. On January 28 uptrend; a retraced candle body tested 61.8% Fibonacci retracement level. The retracement indicates that the pair will rise to level 1.618 Fibonacci extension. That is a high of level 0.7248.
4小時圖表指標閱讀
The 50-day and 21-day SMAs are sloping horizontally. The Kiwi is above the 60% range of the daily stochastic. It indicates that the market is in a bullish momentum. The kiwi is likely to rise as the coin resumes an upward move.
紐元/美元的整體展望
The NZD/USD pair has fallen and resumed upward from the low of 0.7100. According to the Fibonacci tool, the current uptrend will reach a high of level 0.7248.
注意: Learn2.Trade不是財務顧問。 在將資金投資於任何金融資產或展示的產品或事件之前,請先進行研究。 我們不對您的投資結果負責


