
Iṣẹ fun daakọ iṣowo. Algo wa yoo ṣii laifọwọyi ati tilekun awọn iṣowo.
L2T Algo n pese awọn ifihan agbara ere pupọ pẹlu eewu kekere.
24/7 iṣowo cryptocurrency. Nigba ti o sun, a isowo.
Iṣeto iṣẹju 10 pẹlu awọn anfani nla. Iwe itọnisọna ti pese pẹlu rira.
Oṣuwọn aṣeyọri 79%. Awọn abajade wa yoo dun ọ.
Titi di awọn iṣowo 70 fun oṣu kan. Nibẹ ni o wa siwaju sii ju 5 orisii wa.
Ṣiṣe alabapin oṣooṣu bẹrẹ ni £ 58.
Sellers dominate USDCHF market
USDCHF Price Analysis - 17 Kọkànlá Oṣù
If the purchasing momentum is successful in breaking over the $0.89 resistance level, USDCHF le lọ kọja ipele resistance $0.90 and in the direction of the $0.91 barrier levels. If sellers put in enough pressure, they might break through the $0.88 barrier level, which would send the price down into the $0.87 and $0.86 levels
USDCHF ọja
Awọn ipele bọtini:
Awọn ipele iduro: $ 0.89, $ 0.90, $ 0.91
Awọn ipele atilẹyin: $ 0.88, $ 0.87, $ 0.86
USDCHF Aṣa igba pipẹ: Bearish
The daily chart of USDCHF is bearish. Sellers are currently in charge of the USDCHF, and it is falling. It is easily breaking through the $0.91 barrier. Since October 24, buyers have been in charge of the USDCHF oja. The currency pair’s price began to rise once it overcame the $0.88 resistance level. On November 01, at the $0.90 resistance level, a strong bearish engulfing candle pattern emerged, signaling the beginning of a downward trend. The USDCHF is currently testing $0.88 support level.
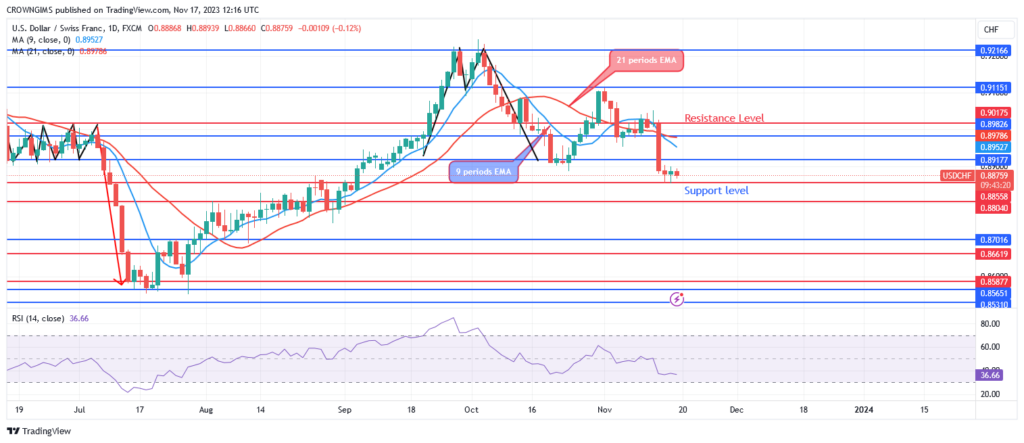
USD/CHF exchange rate is currently below between the 9- and 21-period moving averages, indicating a strengthening of the vendors’ momentum. The Relative Strength Index period 14 at 36 levels indicates a bearish market. If the purchasing momentum is successful in breaking over the $0.89 resistance level, the price can move past the $0.90 resistance level and in the direction of the $0.91 barrier levels. If sellers put in enough pressure, they might break through the $0.88 barrier level, which would send the price down into the $0.87 and $0.86 levels.
USDCHF Aṣa Alabọde-igba: Bearish
As seen in the medium term, USDCHF is declining. The beginning of a negative trend for the currency pair was indicated on October 4 by the appearance of a double top chart pattern close to the $0.92 resistance level. Bearish candles are a representation of the market environment. The $0.89 support level was tested on October 24. It retreated to the $0.90 level. Right now, the sellers are dominating and the $0.88 support level is being tested.
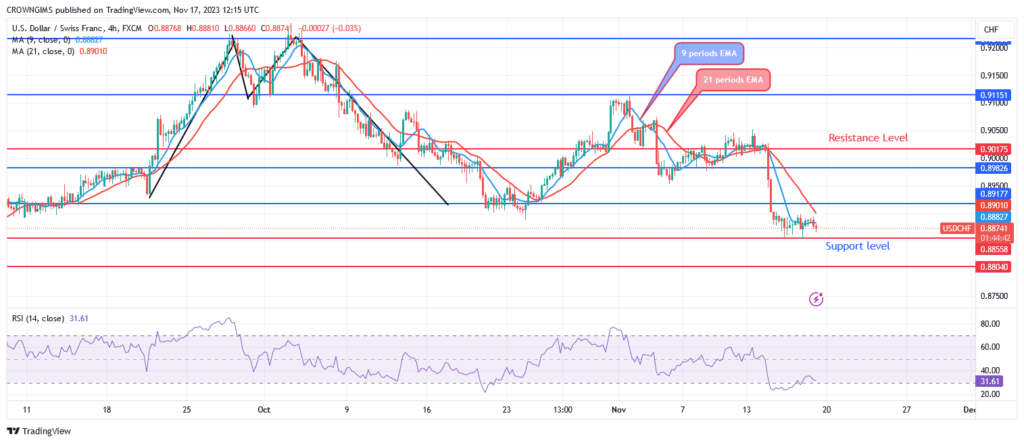
A bearish market is indicated by the fact that the currency pair is trading below both the 21- and 9-period exponential moving averages. With the index at 30, the Relative Strength Index’s period 14 signal line is indicating a sell.
O le ra Lucky Block nibi. Ra LBLOCK
- alagbata
- Idogo min
- O wole
- Ṣabẹwo si Broker

- Syeed iṣowo Cryptocurrency ti o gba ẹbun
- $ 100 idogo to kere ju,
- FCA & Cysec ṣe ilana

- 20% kaabo ajeseku ti to $ 10,000
- Idogo ti o kere ju $ 100
- Daju iroyin rẹ ṣaaju ki o to ka ajeseku

- Lori awọn ọja inawo oriṣiriṣi 100
- Ṣe idoko-owo lati diẹ bi $ 10
- Yiyọ ọjọ kanna ṣee ṣe
- Iṣiro Awọn ọja Iṣowo Moneta pẹlu o kere ju $ 250
- Jade ni lilo fọọmu lati beere fun idogo idogo 50% rẹ