
Musa ukutyala imali ngaphandle kokuba ukulungele ukuphulukana nayo yonke imali oyityalayo. Olu lutyalo-mali olusemngciphekweni omkhulu kwaye akunakwenzeka ukuba ukhuselwe ukuba kukho into engahambi kakuhle. Thatha imizuzu emi-2 ukufunda ngakumbi
Inkonzo yokurhweba ikopi. I-Algo yethu ivula ngokuzenzekelayo kwaye ivale urhwebo.
I-L2T Algo inikezela ngemiqondiso enengeniso ephezulu kunye nomngcipheko omncinci.
24/7 urhwebo cryptocurrency. Ngelixa ulalayo, siyarhweba.
Ukuseta imizuzu eli-10 kunye neenzuzo ezinkulu. Incwadi yesikhokelo ibonelelwe ngokuthenga.
79% izinga lempumelelo. Iziphumo zethu ziya kukuvuyisa.
Ukuya kuthi ga kwi-70 yorhwebo ngenyanga. Kukho ngaphezu kwe-5 izibini ezikhoyo.
Imirhumo yenyanga iqala kwi-£58.
Price action in the Cartesi market has experienced a notable tailwind in the daily market, but headwinds have become active, pushing back against price movements and causing a significant decline. Nevertheless, bullish traders remain well-positioned to regain significant upside traction.
Key CTSI Statistics:
Current Cartesi value: $0.2336
Cartesi Market Cap: $179,024,912
CTSI’s Circulating Supply: 1,000,000,000
CTSI’s Total Supply: 1,000,000,000
Cartesi CoinMarketCap Ranking: 249
Amanqanaba eXabiso aPhambili:
Ukumelana: $0.2336, $0.2400, kunye ne-$0.2500
Inkxaso: $ 0.2300, $ 0.2200, kunye ne- $ 0.2100
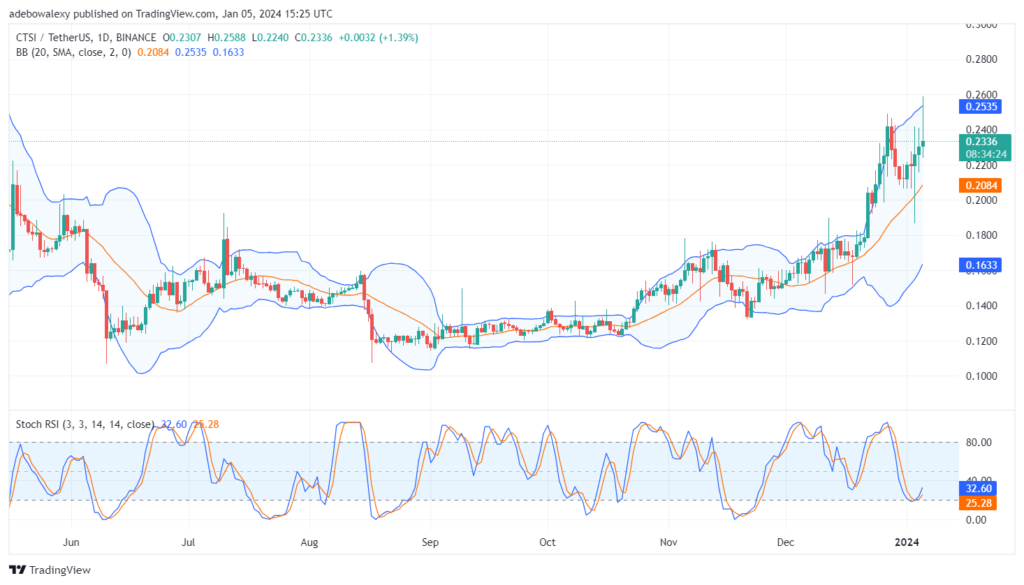
Cartesi Relinquishes a Large Part of Its Gathered Intraday Profits
Ukuziphatha kwesenzo sexabiso kwi ICartesi daily market reveals that headwinds have caused a significant loss of profits for traders holding this token as of today. The corresponding price candle for today’s trading session shows its body contracting downward after testing the $0.2600 resistance. However, looking at price movements over the past four trading sessions, it appears that the market still maintains an upward trajectory.
Another point supporting this opinion is that trading activities are still occurring above the middle band of the Bollinger indicator. Examining the arrangement of price candles for the past four sessions reveals an upside orientation, suggesting that despite the downward correction, price activities still appear progressive. Additionally, the Relative Strength Index (RSI) indicator lines maintain a smooth upside trajectory despite the significant price contraction, implying that price movements may continue on an upward path.
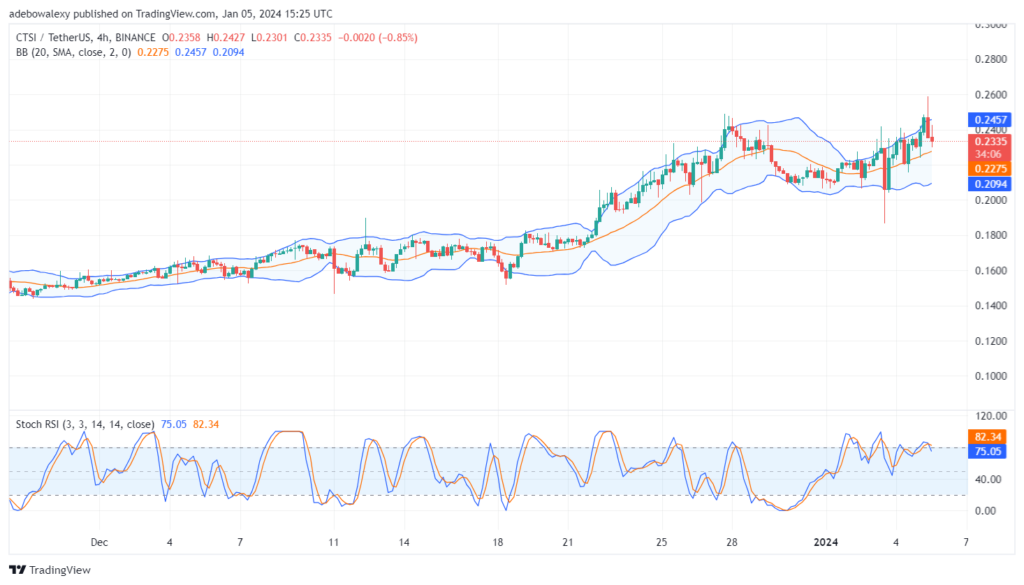
Downward Forces Are Pushing CTSI Hard Against Nearby Support
The I-CTSI 4-hour market provides a closer view of price developments. It reveals that price action had earlier pushed against the uppermost limit of the Bollinger Bands about three sessions ago. According to the operation of the Bollinger Nyanda, such a push is likely to result in a significant downward rebound. The said downward rebound occurred over the past session until now.
It should be noted that the downward correction has slowed down above the middle band of the Bollinger Bands, signaling that bulls may still regain momentum. Meanwhile, the RSI indicator lines have delivered a bearish crossover above the 70 marks, effectively dampening hopes of a possible spontaneous rebound. Therefore, if the downward correction persists, traders can target the $0.2275 mark for a potential upside rebound.
Ukurhweba ngemali ye-crypto kwi-AvaTrade
- umrhwebi
- Idiphozithi encinci
- Inqaku
- Ndwendwela iBroker

- Iqonga lokurhweba nge-Cryptocurrency yokuwonga amabhaso
- $ 100 idiphozithi encinci,
- I-FCA kunye neCysec zilawulwa

- I-20% yamkelekile ibhonasi ye- $ 10,000
- Ubuncinci bediphozithi $ 100
- Qinisekisa iakhawunti yakho ngaphambi kokuba kufakwe ibhonasi

- Ngaphezulu kwe-100 yemveliso eyahlukeneyo yezemali
- Gcina imali encinci njenge- $ 10
- Ukurhoxiswa kwemini enye kunokwenzeka
- Amaxabiso aphantsi okuThengisa
- 50% Ibhonasi yeMkeleki
- Ukuphumelela amabhaso Inkxaso yeyure ezingama-24
- I-akhawunti yeMakethi yeMoneta yeNgxowa-mali enobuncinci be- $ 250
- Khetha ukusebenzisa le fomu ukubanga i-50% yebhonasi yakho yediphozithi