
Inkonzo yokurhweba ikopi. I-Algo yethu ivula ngokuzenzekelayo kwaye ivale urhwebo.
I-L2T Algo inikezela ngemiqondiso enengeniso ephezulu kunye nomngcipheko omncinci.
24/7 urhwebo cryptocurrency. Ngelixa ulalayo, siyarhweba.
Ukuseta imizuzu eli-10 kunye neenzuzo ezinkulu. Incwadi yesikhokelo ibonelelwe ngokuthenga.
79% izinga lempumelelo. Iziphumo zethu ziya kukuvuyisa.
Ukuya kuthi ga kwi-70 yorhwebo ngenyanga. Kukho ngaphezu kwe-5 izibini ezikhoyo.
Imirhumo yenyanga iqala kwi-£58.
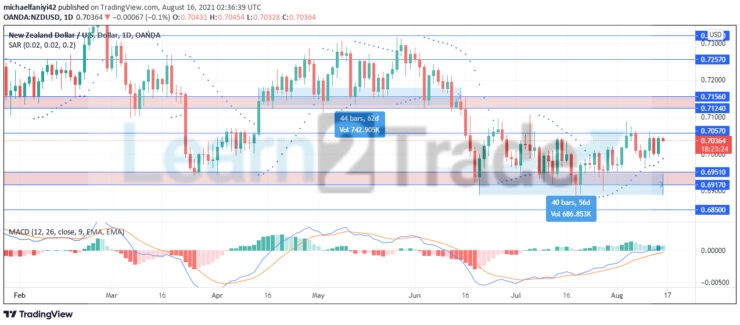
Uhlalutyo lwexabiso leNZDUSD - 16 Agasti
NZDUSD weekly support has stood firm to deny the bears. The market has been primed for a drop, but after several days, the price has been denied the opportunity to go lower. Two major weekly support zones have been responsible for directing the movement of the market – the 0.71560 and the 0.69510 support zones. Price dropped below the 0.71560 support after 43 trading days of persistence in going lower.
NZDUSD Key Level
Amanqanaba okumelana: 0.70570, 0.71240
Amanqanaba enkxaso: 0.69510, 0.69170
 I-NZDUSD yexesha elide iTrend: Bearish
 I-NZDUSD yexesha elide iTrend: Bearish
The market dropped to the 0.69510 support zone with a bearish impulse. While it broke the upper border of the support zone, it didn’t make it past the lower border at 0.69170 before it was repelled. Price bounced up and retested the zone, but it had the same result for the next two consecutive times. On the 20th of July, after bouncing up again, NZDUSD bore down with a force that pierced through the zone, but buyers recovered above the support.
Thereafter, there were two other tests, which were well dealt with by the support. After a total of 40 trading days, the market is now gradually lifting itself back up. The Parabolic SAR (Stop and Reverse) has indicated a direction change since the 26th of July 2021. The MACD (Moving Average Convergence Divergence), however, has its histogram bars reduced despite the price moving upwards. This means there is a convergence of its Moving-Averages lines, which shows an imminent change in direction. Price could test the weekly support again with much greater intensity from this level.
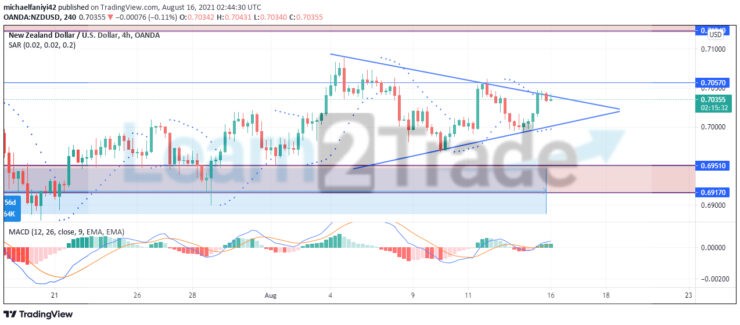
I-NZDUSD yeXesha elifutshane eliQhelekileyo: UkuQala
 I-NZDUSD yeXesha elifutshane eliQhelekileyo: UkuQala
On the 4-hour chart, the market is tapering down into a symmetrical triangle chart pattern. As price moves closer to the tip of the triangle, there is going to be a breakout, which is most likely to the downward side. Sellers will make use of this pattern to test the 0.69510 weekly support again. The MACD shows undulating reducing bars to show the tapering nature of the market.
NZDUSD will once again test the 0.69510 support zone to break below it to reach 0.68500.
Unokuthenga iingqekembe ze-crypto apha: Thenga iingqekembe
Phawula: Funda2 ayisiyo ingcebiso kwezemali. Yenza uphando ngaphambi kokutyala imali yakho kuyo nayiphi na impahla yezezimali okanye imveliso ebonisiweyo okanye umcimbi. Asinaxanduva lakho kwiziphumo zotyalo mali.
- umrhwebi
- Idiphozithi encinci
- Inqaku
- Ndwendwela iBroker

- Iqonga lokurhweba nge-Cryptocurrency yokuwonga amabhaso
- $ 100 idiphozithi encinci,
- I-FCA kunye neCysec zilawulwa

- I-20% yamkelekile ibhonasi ye- $ 10,000
- Ubuncinci bediphozithi $ 100
- Qinisekisa iakhawunti yakho ngaphambi kokuba kufakwe ibhonasi

- Ngaphezulu kwe-100 yemveliso eyahlukeneyo yezemali
- Gcina imali encinci njenge- $ 10
- Ukurhoxiswa kwemini enye kunokwenzeka
- Amaxabiso aphantsi okuThengisa
- 50% Ibhonasi yeMkeleki
- Ukuphumelela amabhaso Inkxaso yeyure ezingama-24
- I-akhawunti yeMakethi yeMoneta yeNgxowa-mali enobuncinci be- $ 250
- Khetha ukusebenzisa le fomu ukubanga i-50% yebhonasi yakho yediphozithi