
Kopya ticareti için hizmet. Algo'muz işlemleri otomatik olarak açar ve kapatır.
L2T Algo, minimum riskle oldukça karlı sinyaller sağlar.
24/7 kripto para ticareti. Siz uyurken biz ticaret yaparız.
Önemli avantajlarla 10 dakikalık kurulum. Kılavuz, satın alma işlemiyle birlikte verilir.
%79 Başarı oranı. Sonuçlarımız sizi heyecanlandıracak.
Ayda en fazla 70 işlem. 5'ten fazla çift mevcuttur.
Aylık abonelikler £ 58'den başlar.
Anahtar Direnç Seviyeleri: $ 60, $ 62, $ 64
Temel Destek Seviyeleri: 40 $, 38 $, 36 $
Polkadot (DOT) Fiyat Uzun Vadeli Trend: Ayı
Bugün, DOT fiyatı is falling after rejection from the $32 high. In the previous price action, Polkadot plunged to $16 low and pulled back as bulls bought the dips. However, the uptrend was short-lived as DOT price faced resistance at $32.50. Buyers could not sustain the bullish momentum above the recent high. Meanwhile, on May 19 downtrend, a retraced candle body tested the 61.8% Fibonacci retracement level. The retracement indicates that DOT price will fall to level 1.618 Fibonacci extension .
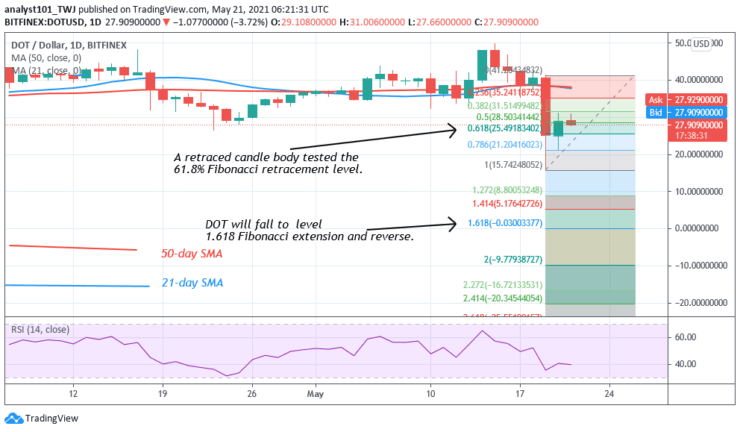
Günlük Grafik Göstergeleri Okuma:
Polkadot has fallen to level 40 of the Relative Strength Index period 14. It indicates that the coin is in the downtrend zone below the centerline 50. The crypto’s price has broken below the moving averages which suggests that the coin is in the bearish trend zone and capable of falling. The 21-day SMA and the 50-day SMA are sloping horizontally indicating the sideways trend.
Polkadot (DOT) Orta Vadeli Trend: Ayı
On the 4 hour chart, the altcoin has been in a sideways trend since February. On May 20, the crypto plunged to $21 low as bulls bought the dips. The price corrected upward but the uptrend is facing resistance at the high of $30. Meanwhile, on May 19 downtrend; a retraced candle body tested the 50% Fibonacci retracement level. The retracement indicates that DOT will fall to level 2.0 Fibonacci extension. From the price action, the altcoin is retracing after the rejection from the recent high.
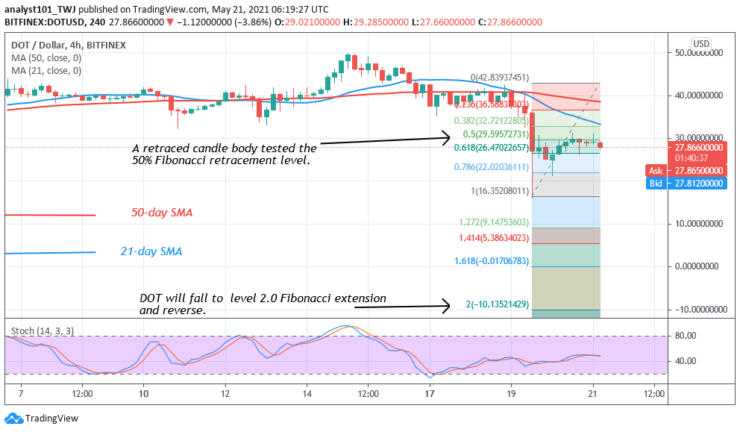
4 saatlik Grafik Göstergeleri Okuma
The altcoin is above the 40% range of the daily stochastic. It indicates that the market is in a bullish momentum. This is contrary to the price action which is retracing from the recent high. The 21-day SMA and the 50-day SMA are sloping downward indicating the downtrend.
Polkadot için Genel Görünüm (DOT)
Polkadot (DOT) price is in a downward correction. The altcoin is facing rejection from the recent high. In the meantime, the crypto’s price is fluctuating between $16 and $30. The altcoin will trend if the levels are breached.
Kripto paraları buradan satın alabilirsiniz: Jeton satın alın
not: Learn2Trade.com bir finans danışmanı değildir. Herhangi bir finansal varlığa veya sunulan ürün veya etkinliğe yatırım yapmadan önce araştırmanızı yapın. Yatırım sonuçlarınızdan sorumlu değiliz
- komisyoncu
- Min Mevduat
- Puan
- Broker'ı ziyaret et

- Ödüllü Cryptocurrency ticaret platformu
- Minimum 100 $ depozito,
- FCA ve Cysec düzenlenmiştir

- 20 $ 'a kadar% 10,000 hoşgeldin bonusu
- Minimum para yatırma miktarı $ 100
- Bonus yatırılmadan önce hesabınızı doğrulayın

- 100'den fazla farklı finansal ürün
- 10 $ 'a kadar yatırım yapın
- Aynı gün para çekme mümkündür
- Minimum 250$ ile Moneta Markets hesabına para yatırın
- % 50 para yatırma bonusunuzu talep etmek için formu kullanmayı seçin