
Au'aunaga mo kopi fefa'ataua'iga. Ole matou Algo e otometi lava ona tatala ma tapunia fefaʻatauaiga.
O le L2T Algo o lo'o tu'uina atu fa'ailoga sili ona aoga ma fa'aletonu la'ititi.
24/7 cryptocurrency fefaʻatauaʻiga. A o e momoe, matou te fefaatauai.
10 minute seti faʻatasi ai ma faʻamanuiaga tele. O loʻo tuʻuina atu le tusi lesona ma le faʻatau.
79% Fa'amanuiaina fua faatatau. O a matou taunuuga o le a faʻafiafiaina oe.
E oʻo atu i le 70 fefaʻatauaʻiga i le masina. E silia ma le 5 paipa o lo'o avanoa.
E amata totogi masina ile £58.
BNBUSD Tau iloiloga - Ianuari 15
In case the sellers were able to push the price below the support level of $37 and the daily candlestick close below the level, then, the price may decline further to test the $31 and $27 support level. Inability to break down the support level of $37, the bullish trend may continue to target the resistance levels at $41, $44, and $48.
Maketi GBP / JPY
Vaega autu:
Tulaga o sapalaiina: $ 41, $ 44, $ 48
Laʻasaga o manaʻoga: $ 37, $ 31, $ 27
BNBUSD Taimi umi: Bullish
The bulls return to the BNBUSD market after price retracement. In other words, BNB is bullish in the long-term outlook. On December 19, the bulls take over the market by breaking up the resistance level of $31. The price soars towards the resistance level of $44 after it breaks up the resistance levels of $37 and $41. The price pulled back to retest the broken level of $31. The bulls are taken over the BNBUSD market at the moment.
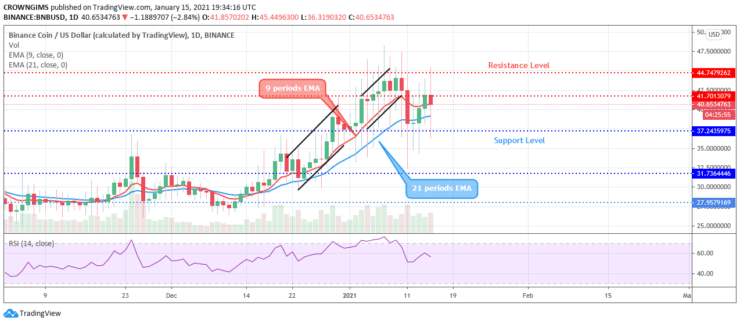
The price has retested the dynamic support levels of 21 periods EMA and the 9 periods EMA and the coin is trading above the two EMAs at the close range which connotes the gradual increase of the bulls’ momentum. The Relative Strength Index period 14 is at 60 levels with the signal lines pointing down to indicate a sell signal which may be a pullback. In case the sellers were able to push the price below the support level of $37 and the daily candlestick close below the level, then, the price may decline further to test the $31 and $27 support level. Inability to break down the support level of $37, the bullish trend may continue to target the resistance levels at $41, $44, and $48.
BNBUSD faʻatulagaina vaitaimi: Bearish
BNBUSD is bearish in the 4-hour chart. Last week. The coin tested the resistance level of $44 on January 10 but there is no enough pressure to penetrate the level. A bearish engulfing candle emerges; which indicates an increase in the bears’ momentum. The price descends and tested the support level of $36. The Crypto bounces and increases to test the $41 price level. The price may continue its bearish movement.
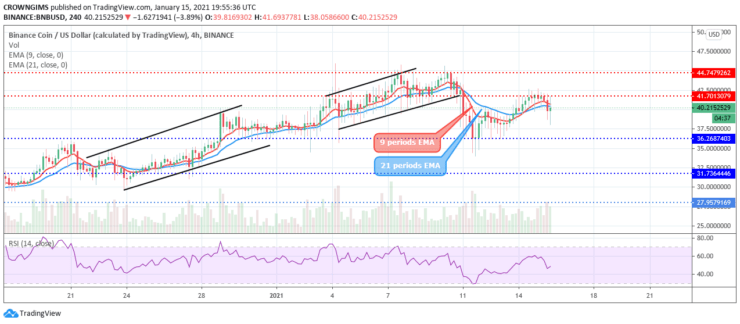
The 9 periods EMA is trying to cross the 21 periods EMA downside while the coin is trading below the two EMAs which connotes a decrease in the bulls’ momentum. The RSI indicator period 14 is above 40 levels and the signal lines bending up to indicate a buy signal.
- posi
- Min Teugatupe
- togi
- Asiasia le Faletupe

- Taui manumalo Cryptocurrency platform
- $ 100 totogi maualalo,
- FCA & Cysec faʻatonutonu

- 20% faʻafeiloaʻiga ponesi e oʻo atu i le $ 10,000
- Tupe maualalo $ 100
- Faʻamaonia lau teuga tupe muamua o le ponesi

- Sili atu 100 eseʻese oloa tautupe
- Inivesi mai sina $ 10
- E mafai ona toʻesea le aso e tasi
- Le tau maualalo o tau o fefaatauaiga
- 50% ponesi Faafeiloaiga
- Faʻailoga-manumalo 24 Itula Lagolago
- Tupe Moneta Markets teutupe ma le maualalo o le $ 250
- Filifili i le faʻaaogaina o le fomu e tapa ai lau 50% tupe teu