
Услуга за тргување со копии. Нашиот Algo автоматски отвора и затвора занаети.
L2T Algo обезбедува високо профитабилни сигнали со минимален ризик.
24/7 тргување со криптовалути. Додека вие спиете, ние тргуваме.
Поставување од 10 минути со значителни предности. Прирачникот е даден со купувањето.
79% стапка на успех. Нашите резултати ќе ве возбудат.
До 70 занаети месечно. Достапни се повеќе од 5 пара.
Месечните претплати започнуваат од 58 фунти.
S&P 500 market may experience increased bearish pressure
Анализа на цените на S&P 500 – 03 јануари
S&P 500 може да прекрши the $3740 support level if selling pressure increases, and more selling pressure could push the price as low as $3649 and $3493 levels. If the support level of $3740 holds, the price may turn around and climb toward the resistance levels of $3926, $4087, and $4169.
Клучни нивоа:
Ниво на отпорност: 3926 долари, 4087 долари, 4169 долар
Нивоа на поддршка: 3740 $, 3649 $, 3493 $
S&P 500 Долгорочен тренд: наменски
S&P 500 is in a bearish trend on the daily chart. The bulls lost steam after the price passed the $4087 barrier threshold. A tiny double-top chart pattern formed at the aforementioned level, indicating that sellers are ready to seize control of the market. As the sellers’ pressure increased, the price broke through the $3926 support level. At this time, $3740 is the desired support level.
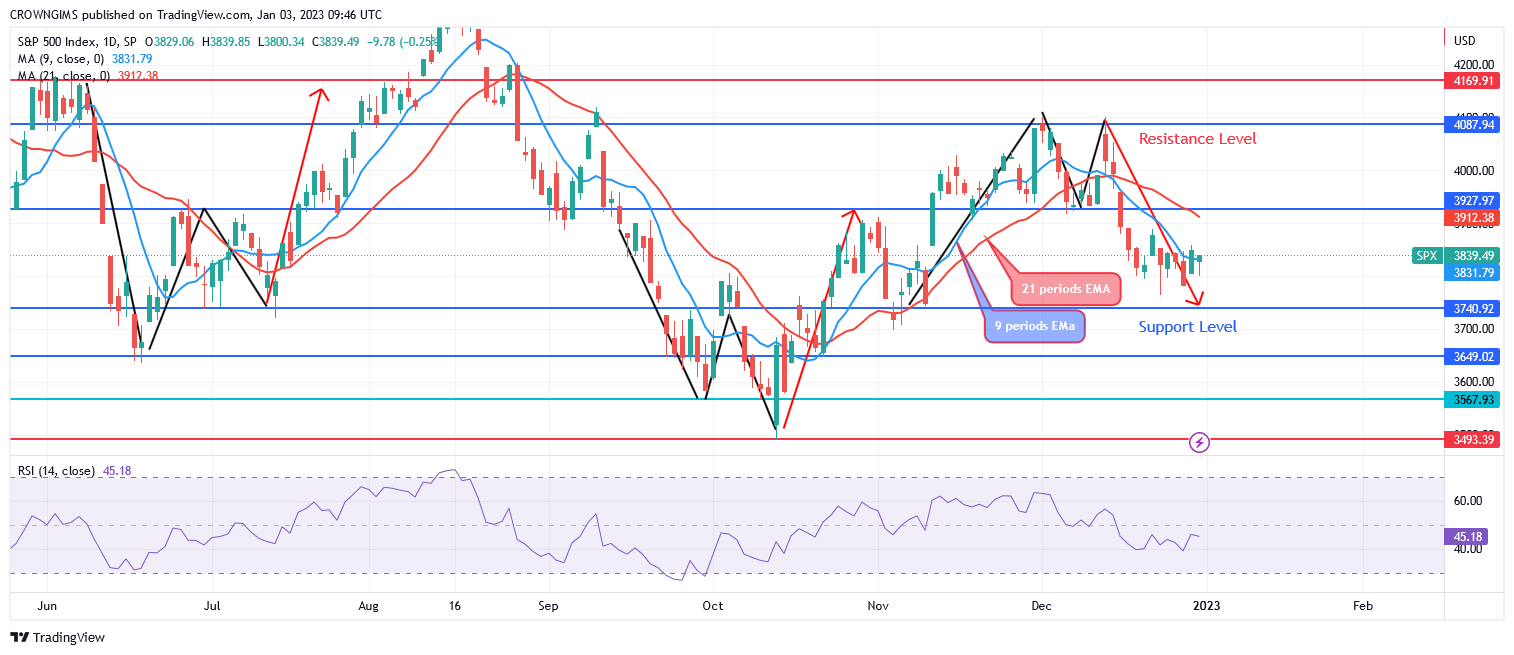
Bearish momentum is present because the S&P 500 is trading below both the 9- and 21-period exponential moving averages. The S&P 500 may violate the $3740 support level if selling pressure increases, and more selling pressure could push the price as low as $3649 and $3493 levels. If the support level of $3740 holds, the price may turn around and climb toward the resistance levels of $3926, $4087, and $4169. A sell signal is being displayed because the Relative Strength Index period 14 is at 45 and the signal line is moving lower.
S&P 500 Среднорочен тренд: наменски
The 4-hour chart’s forecast indicates that the S&P 500 is headed downward. The price fluctuation in the 4-hour window resulted in an “M” chart pattern. The price surpassed the $4087 barrier mark. It has breached the former support level of $3926, which it had previously tested. The price direction is determined by the bearish chart pattern that was generated.
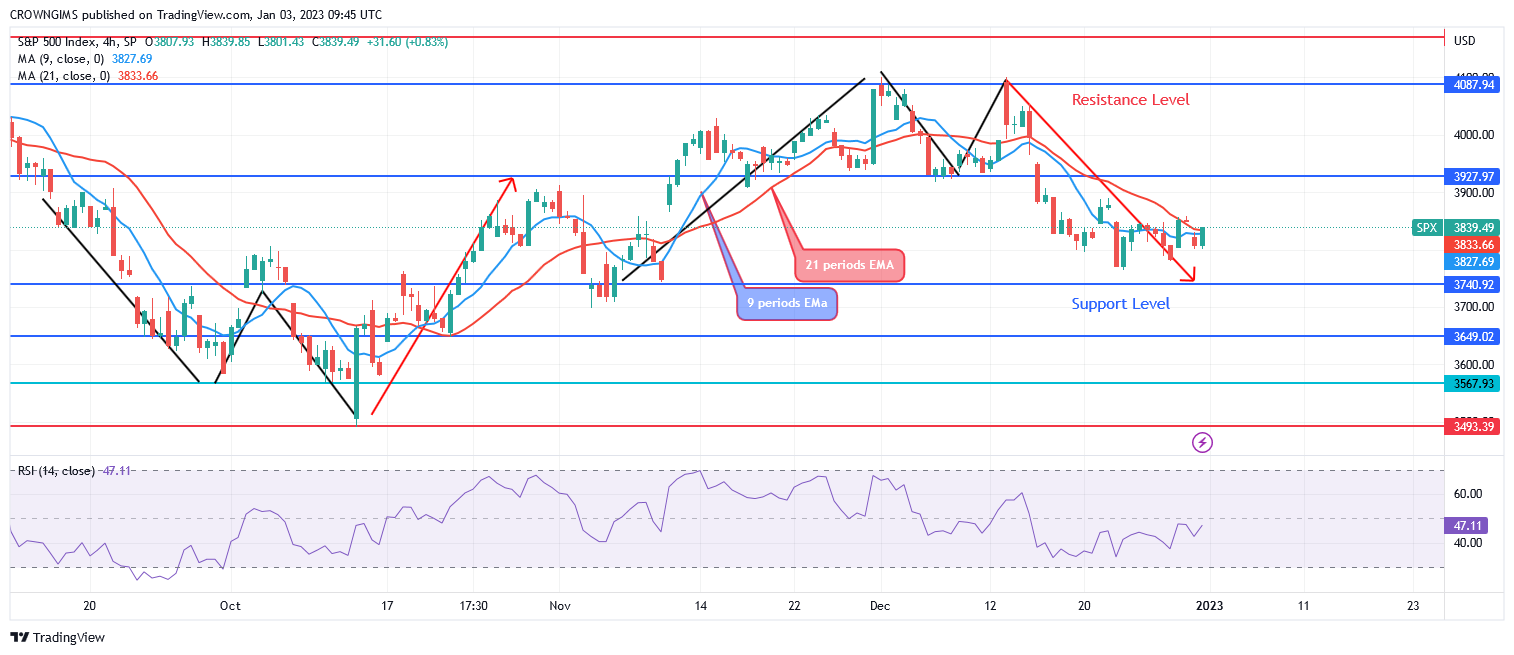
Because it is trading below both the 9- and 21-period exponential moving averages, the price is heading downward. The Relative Strength Index period 14 at 47 levels displays a bullish signal.
Можете да купите Lucky Block овде. Купете LBLOCK
- Брокер
- Мин депозит
- Резултат
- Посетете го брокерот

- Наградувана платформа за тргување со криптовалути
- 100 минимален депозит,
- FCA & Cysec регулирани

- 20% бонус за добредојде до 10,000 УСД
- Минимален депозит 100 $
- Потврдете ја вашата сметка пред да се кредитира бонусот

- Над 100 различни финансиски производи
- Инвестирајте од 10 долари
- Истовремено е можно повлекување
- Најниски трошоци за тргување
- 50% Добредојдовте бонус
- Наградувана поддршка од 24 часа
- Фонд Монета пазари сметка со минимум 250 американски долари
- Одлучете се со користење на формуларот за да побарате бонус од 50% за депозит