
Prekybos kopijavimo paslauga. Mūsų Algo automatiškai atidaro ir uždaro sandorius.
L2T Algo teikia labai pelningus signalus su minimalia rizika.
24/7 prekyba kriptovaliutomis. Kol jūs miegate, mes prekiaujame.
10 minučių sąranka su dideliais pranašumais. Instrukcija pateikiama kartu su pirkiniu.
79% sėkmės rodiklis. Mūsų rezultatai jus sužavės.
Iki 70 sandorių per mėnesį. Yra daugiau nei 5 poros.
Mėnesio abonementai prasideda nuo 58 GBP.
Pagrindinės palaikymo zonos: 26000, 25500, 25000
JAV Volstryto 30 (US30USD) ilgalaikė tendencija: meškiukas
US Wall Street 30 index is in an uptrend showing the support levels of price. The uptrend commenced in June and ended in February 2020. The interruption of the uptrend was that the market reached the overbought region. US30USD reached a high of 29500 and was overbought. The upward move becomes impossible as the index was resisted.
The market fell to a low of 25500. In the overbought region, sellers are on hand to push US30USD downward. Nonetheless, the index fell to a low of 25500 and was oversold. The current low or support is likely to hold as we expect buyers at the oversold region to push the price upward.
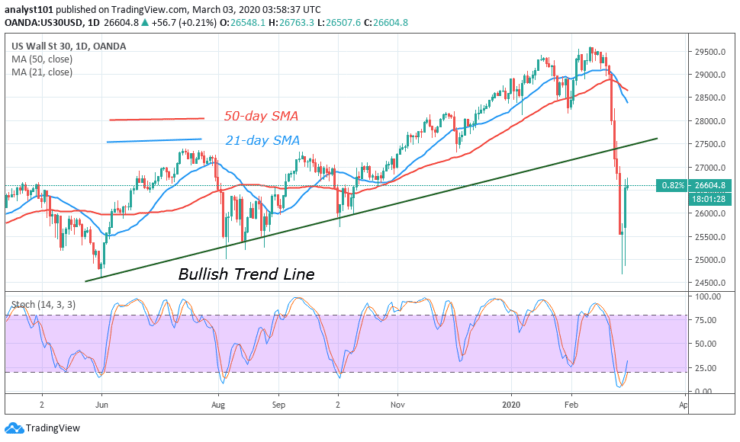
Dienos diagramos rodiklių skaitymas:
The downward movement of the index has resulted in the US30USD to be in an oversold region. The index has fallen below a 20% range of the daily stochastic. This also means that US30USD is in a strong bearish momentum. We expect buyers to be on hand to push the index upward. US30USD will remain in the oversold region as long as buyers fail to emerge.
JAV Volstryto 30 (US30USD) Vidutinės trukmės tendencija: „Bearish“
On the 4- hour chart, the index has been in a sideways trend before the price breakdown. US30USD has fluctuated between 28500 and 29500 for sometimes. The bulls and the bears have earlier been testing the lower and the upper price range to break it. However, the market fell after being resisted by the EMAs.
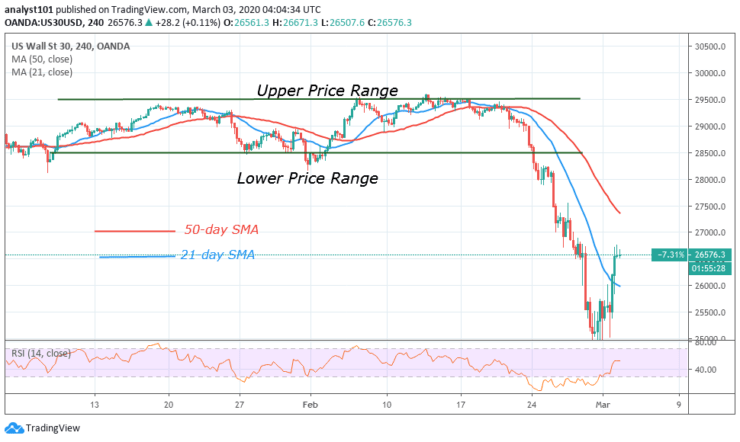
4 valandų diagramos rodiklių skaitymas
The index is currently at level 52 of the Relative Strength Index period 14. The index is likely to rise because it is above the centerline 50. The 21-day SMA and the 50-day SMA are sloping southward indicating the downtrend. Buyers will emerge in the oversold region to push the index upward. The downward move reaches a low of 25000 and rebounded.
Bendra JAV „Wall Street 30“ (US30USD) perspektyva
US30USD is recovering after the price breakdown. As the market fell to the oversold region, there is a tendency for the market to rise. The stochastic and the Relative Strength Index are indicating an uptrend move. Buyers will be on hand to push US30USD upward.
Instrumentas: US Wall Street 30 (US30USD)
Užsakymas: Pirk
Įvažiavimo kaina: 26573
Stotelė: 26000
Tikslas: 29500
Pastaba: „Learn2Trade.com“ nėra finansų patarėjas. Atlikite tyrimus prieš investuodami savo lėšas į bet kokį finansinį turtą, pristatytą produktą ar įvykį. Mes neatsakome už jūsų investavimo rezultatus
- Tarpininkas
- Minimalus depozitas
- Balas
- Apsilankykite tarpininke

- Apdovanojimus pelniusi kriptovaliutų prekybos platforma
- Minimalus 100 USD indėlis,
- FCA ir „Cysec“ reguliuojami

- 20% priėmimo premija iki 10,000 XNUMX USD
- Minimalus indėlis $ 100
- Prieš įskaitydami premiją, patikrinkite savo sąskaitą

- Daugiau nei 100 skirtingų finansinių produktų
- Investuokite nuo vos 10 USD
- Galima pasitraukti iš tos pačios dienos
- Fondo „Moneta Markets“ sąskaita, turinti mažiausiai 250 USD
- Norėdami pasinaudoti 50% indėlio premija, pasirinkite formą