Prekybos kopijavimo paslauga. Mūsų Algo automatiškai atidaro ir uždaro sandorius.
L2T Algo teikia labai pelningus signalus su minimalia rizika.
24/7 prekyba kriptovaliutomis. Kol jūs miegate, mes prekiaujame.
10 minučių sąranka su dideliais pranašumais. Instrukcija pateikiama kartu su pirkiniu.
79% sėkmės rodiklis. Mūsų rezultatai jus sužavės.
Iki 70 sandorių per mėnesį. Yra daugiau nei 5 poros.
Mėnesio abonementai prasideda nuo 58 GBP.
The multiple time frames trading strategy is a Forex trading strategy that works by following a single currency pair over different time frames. By following the price chart we can see the highs and lows and establish the overall and temporary trend. However, by looking at the different time frames we can see changes and patterns that we were not able to spot by using a single time frame.
4
Mokėjimo metodai
Prekybos platformos
Reguliuoja
Pagalba
Minimalus užstatas
Svertas maks
Valiutų poros
klasifikacija
Mobile App "
Reitingas
Iš viso išlaidų
$ 0
![]() Komisija
3.5
Komisija
3.5
Minimalus užstatas
$100
Skleisti min.
Kintamieji taškai
Svertas maks
100
Valiutų poros
40
Prekybos platformos
Finansavimo metodai


Reguliuoja
FPA
Kuo galima prekiauti
forex
Indeksai
Veiksmai
Kriptotinės valiutos
Žaliavos
Vidutinis skirtumas
EUR / LTL
-
EUR / USD
-
EUR / JPY,
0.3
EUR / CHF
0.2
GBP / USD
0.0
GBP / JPY,
0.1
GBP / CHF
0.3
USD / JPY
0.0
USD / CHF
0.2
CHF / JPY
0.3
Papildomas mokestis
Nuolatinė norma
Kintamieji
Konversija
Kintamieji taškai
Reguliavimas
taip
FPA
Ne
CYSEC
Ne
ASIC
Ne
CFTC
Ne
NFA
Ne
BAFINAS
Ne
CMA
Ne
SCB
Ne
DFSA
Ne
CBFSAI
Ne
BVIFSC
Ne
FSCA
Ne
FSA
Ne
FFAJ
Ne
ADGM
Ne
FRSA
71% mažmeninių investuotojų sąskaitų praranda pinigus, kai prekiauja CFD su šiuo teikėju.
Reitingas
Iš viso išlaidų
$ 0
![]() Komisija
0
Komisija
0
Minimalus užstatas
$100
Skleisti min.
- kauliukai
Svertas maks
400
Valiutų poros
50
Prekybos platformos
Finansavimo metodai
Reguliuoja
CYSECASICCBFSAIBVIFSCFSCAFSAFFAJADGMFRSA
Kuo galima prekiauti
forex
Indeksai
Veiksmai
Kriptotinės valiutos
Žaliavos
Etfs
Vidutinis skirtumas
EUR / LTL
1
EUR / USD
0.9
EUR / JPY,
1
EUR / CHF
1
GBP / USD
1
GBP / JPY,
1
GBP / CHF
1
USD / JPY
1
USD / CHF
1
CHF / JPY
1
Papildomas mokestis
Nuolatinė norma
-
Konversija
- kauliukai
Reguliavimas
Ne
FPA
taip
CYSEC
taip
ASIC
Ne
CFTC
Ne
NFA
Ne
BAFINAS
Ne
CMA
Ne
SCB
Ne
DFSA
taip
CBFSAI
taip
BVIFSC
taip
FSCA
taip
FSA
taip
FFAJ
taip
ADGM
taip
FRSA
71% mažmeninių investuotojų sąskaitų praranda pinigus, kai prekiauja CFD su šiuo teikėju.

Reitingas
Iš viso išlaidų
$ 0
![]() Komisija
6.00
Komisija
6.00
Minimalus užstatas
$10
Skleisti min.
- kauliukai
Svertas maks
10
Valiutų poros
60
Prekybos platformos
Finansavimo metodai
Kuo galima prekiauti
forex
Indeksai
Kriptotinės valiutos
Vidutinis skirtumas
EUR / LTL
1
EUR / USD
1
EUR / JPY,
1
EUR / CHF
1
GBP / USD
1
GBP / JPY,
1
GBP / CHF
1
USD / JPY
1
USD / CHF
1
CHF / JPY
1
Papildomas mokestis
Nuolatinė norma
-
Konversija
- kauliukai
Reguliavimas
Ne
FPA
Ne
CYSEC
Ne
ASIC
Ne
CFTC
Ne
NFA
Ne
BAFINAS
Ne
CMA
Ne
SCB
Ne
DFSA
Ne
CBFSAI
Ne
BVIFSC
Ne
FSCA
Ne
FSA
Ne
FFAJ
Ne
ADGM
Ne
FRSA
Jūsų kapitalui gresia pavojus.
Reitingas
Iš viso išlaidų
$ 0
![]() Komisija
0.1
Komisija
0.1
Minimalus užstatas
$50
Skleisti min.
- kauliukai
Svertas maks
500
Valiutų poros
40
Prekybos platformos
Finansavimo metodai
Kuo galima prekiauti
forex
Indeksai
Veiksmai
Žaliavos
Vidutinis skirtumas
EUR / LTL
-
EUR / USD
-
EUR / JPY,
-
EUR / CHF
-
GBP / USD
-
GBP / JPY,
-
GBP / CHF
-
USD / JPY
-
USD / CHF
-
CHF / JPY
-
Papildomas mokestis
Nuolatinė norma
-
Konversija
- kauliukai
Reguliavimas
Ne
FPA
Ne
CYSEC
Ne
ASIC
Ne
CFTC
Ne
NFA
Ne
BAFINAS
Ne
CMA
Ne
SCB
Ne
DFSA
Ne
CBFSAI
Ne
BVIFSC
Ne
FSCA
Ne
FSA
Ne
FFAJ
Ne
ADGM
Ne
FRSA
71% mažmeninių investuotojų sąskaitų praranda pinigus, kai prekiauja CFD su šiuo teikėju.
Find out more about Trend Trading – Forex Trading Strategies
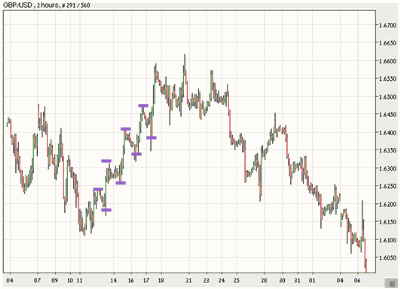
In the chart above every candlestick represents 2 hours. The chart consists of 360 candlesticks that altogether constitute 1 full month.
Learn more about Candlestick – Forex Trading Strategies
On the left side of the chart, marked with purple markings, are mini-trends. If we would have looked at a shorter time frame we would have seen these mini-trends but would not have seen the bigger picture which shows a much larger bullish trend.
Now let’s look at an even larger time frame and see how it affects our understanding of the trend.
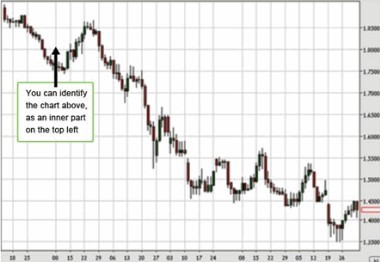
This is a chart of a half-year time frame. Each candlestick on this chart represents 1 day. As you can see, what we analyzed as a bullish trend appears in this time frame to be just a small pullback of an overall bearish trend.
Clearly, when looking at a single time frame you can’t know the whole story. As a rule, it is critical to know the whole story before making an investment. Examining the price change over numerous time frames can act as an indicator in telling us when to enter or exit a trade.
Standard time frames to focus on are time frames in which each candlestick represents 15 minutes, 30 minutes or 1 hour. These time frames fall right in the middle as they allow the trader enough time to examine the market before making a move but are not too long-term, making them profitable over relatively short periods of time.
To sum up, each time frame has its benefits. Long time frames allow us to understand the bigger picture and identify the overall trend. Average time frames present the short term trend and show us what is happening in the market right now. Short time frames are our way of recognizing the exact window for when to make our move.
To successfully execute multiple time frame analysis, the suggested working process is to choose a time frame to work in and then verify your move with a longer time frame. Working with three different time frames is possible. However, be careful when working with three or more time frames as it can cause a great deal of confusion and chart mix-ups.