How many times have you entered into a trend only to find out that it has already run its course and you were too late? Many of the Forex trading strategies that we use help us predict which way the market is trending and whether to expect a bearish or bullish trend, but give little or no indication as to the strength of the trend. Sometimes these forex trading strategies will lead us to enter a trade and that trade will turn out to yield very little income, even though it went in the direction that we anticipated.
ADX, or Average Directional Index, is a tool that is designed to help us anticipate the strength of a trend to avoid these kinds of situations. In combination with other Forex trading strategies the ADX can allow us to fully understand the trend and thus only enter trades that will yield big profits. ADX trading strategy is not a standalone Forex trading strategy as it only gives an indication as to the strength of the trend. It does not give any indication as to the direction of the trend and for that reason, it must be used along with other Forex trading strategies.
3
Payment methods
Trading platforms
Regulated by
Support
Min.Deposit
Leverage max
Currency Pairs
Classification
Mobile App
Rating
Total cost
$ 0
![]() Commission
3.5
Commission
3.5
Min.Deposit
$100
Spread min.
Variables pips
Leverage max
100
Currency Pairs
40
Trading platforms
Funding Methods


Regulated by
FCA
What you can trade
Forex
Indices
Actions
Cryptocurrencies
Raw Materials
Average spread
EUR/GBP
-
EUR/USD
-
EUR/JPY
0.3
EUR/CHF
0.2
GBP/USD
0.0
GBP/JPY
0.1
GBP/CHF
0.3
USD/JPY
0.0
USD/CHF
0.2
CHF/JPY
0.3
Additional Fee
Continuous rate
Variables
Conversión
Variables pips
Regulation
Yes
FCA
No
CYSEC
No
ASIC
No
CFTC
No
NFA
No
BAFIN
No
CMA
No
SCB
No
DFSA
No
CBFSAI
No
BVIFSC
No
FSCA
No
FSA
No
FFAJ
No
ADGM
No
FRSA
71% of retail investor accounts lose money when trading CFDs with this provider.
Rating
Total cost
$ 0
![]() Commission
0
Commission
0
Min.Deposit
$100
Spread min.
- pips
Leverage max
400
Currency Pairs
50
Trading platforms
Funding Methods
Regulated by
CYSECASICCBFSAIBVIFSCFSCAFSAFFAJADGMFRSA
What you can trade
Forex
Indices
Actions
Cryptocurrencies
Raw Materials
Etfs
Average spread
EUR/GBP
1
EUR/USD
0.9
EUR/JPY
1
EUR/CHF
1
GBP/USD
1
GBP/JPY
1
GBP/CHF
1
USD/JPY
1
USD/CHF
1
CHF/JPY
1
Additional Fee
Continuous rate
-
Conversión
- pips
Regulation
No
FCA
Yes
CYSEC
Yes
ASIC
No
CFTC
No
NFA
No
BAFIN
No
CMA
No
SCB
No
DFSA
Yes
CBFSAI
Yes
BVIFSC
Yes
FSCA
Yes
FSA
Yes
FFAJ
Yes
ADGM
Yes
FRSA
71% of retail investor accounts lose money when trading CFDs with this provider.
Rating
Total cost
$ 0
![]() Commission
0.1
Commission
0.1
Min.Deposit
$50
Spread min.
- pips
Leverage max
500
Currency Pairs
40
Trading platforms
Funding Methods
What you can trade
Forex
Indices
Actions
Raw Materials
Average spread
EUR/GBP
-
EUR/USD
-
EUR/JPY
-
EUR/CHF
-
GBP/USD
-
GBP/JPY
-
GBP/CHF
-
USD/JPY
-
USD/CHF
-
CHF/JPY
-
Additional Fee
Continuous rate
-
Conversión
- pips
Regulation
No
FCA
No
CYSEC
No
ASIC
No
CFTC
No
NFA
No
BAFIN
No
CMA
No
SCB
No
DFSA
No
CBFSAI
No
BVIFSC
No
FSCA
No
FSA
No
FFAJ
No
ADGM
No
FRSA
71% of retail investor accounts lose money when trading CFDs with this provider.
Understanding the Average Directional Index is very easy. It ranges on a scale from 0-100, 100 indicating a very strong trend and 0 indicating a non-existent trend. If the ADX is very close to 0, expect a sideways moving trend, meaning the market will not go up or down but rather stay around the same value with small corrections. When the ADX is low it is a good time to consider closing the trade as you don’t stand to make a profit from a sideways moving market. On the other hand, if the ADX is very high, expect a fast moving trend which means that it is probably a good time to enter a trade. Don’t forget, the ADX is only an indication of the strength of the trend and does not indicate whether the price will go up or down.
Values of ADX that are considered high are above 50. Whenever there is a strong trend, the ADX will be above 50. Weak trends are indicated by values under 20 on the ADX scale.
This example clearly shows how we can use the Average Directional Index to analyze the trend:
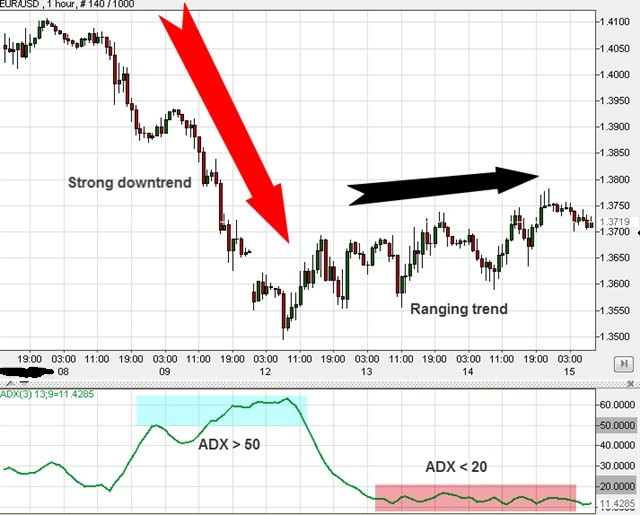
As you can see, in the first part of the chart there is a very strong bearish trend and the ADX (shown on the bottom) is very high. Once the trend ends, and the market begins a sideways stage, the ADX drops below 20. In this case, using the ADX could have helped us exit the trade when it had reached the end of the trend and not waste our time and resources on currency pairs that are not going anywhere.
Combining the ADX indicator with your other Forex trading strategies can give you just the edge you need to increase your profits.