
주요 하이라이트
LTC struggles to break above the SMAs
Litecoin may face further rejection at the recent high
Litecoin (LTC) 현재 통계
현재 가격 : $ 47.57
시가 총액 : $ 3,125,947,038
거래량 : $ 1,810,961,358
주요 공급 구역 : $ 70, $ 80, $ 90
주요 수요 구역 : $ 50, $ 30, $ 10
Litecoin (LTC) 가격 분석 20 년 2020 월 XNUMX 일
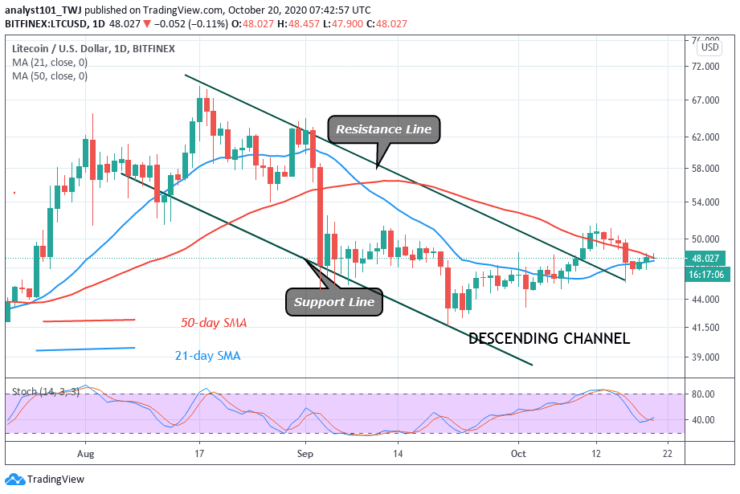
For the past week, buyers were in control as they push price above the moving averages. The bulls could not sustain the uptrend as price was rejected at the $51 resisted. The coin fell to the low above $45, while buyers struggle to resume a fresh uptrend.
Today, Litecoin is rising as it approaches the previous high of $51. If buyers push price above $51, the upside momentum will resume. The coin will rally to $58 or $62 high. On the other hand, if the coin fails to push above the SMAs. The crypto is likely to fall into the range-bound zone.
Litecoin (LTC) 기술 지표 읽기
LTC price has broken above the 21-day SMA. A break above the SMAs will propel the coin to rise. The crypto is above the 40% range of the daily stochastic. It indicates that the coin is in a bullish momentum. The SMAs are sloping southward indicating the downtrend.
결론
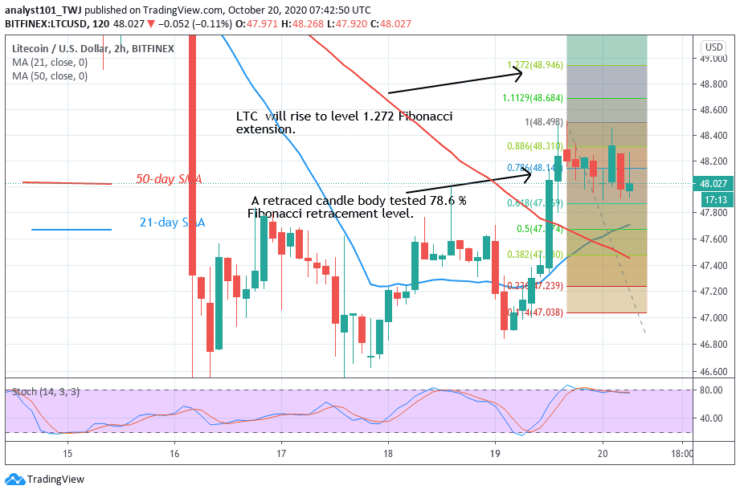
From the price action, LTC has shown signs of bullish momentum. On October 19 uptrend, a retraced candle body tested the 78.6 % Fibonacci retracement level. With the retracement, the coin is expected to rise and reach level 1.272 Fibonacci extension. That is LTC will rise and reach a high of $48.94 but will reverse and return to the 78.6% Fibonacci retracement level.
주의 사항: 2. 무역은 재정 고문이 아닙니다. 금융 자산이나 제시된 제품 또는 이벤트에 자금을 투자하기 전에 조사를 수행하십시오. 우리는 귀하의 투자 결과에 대해 책임을지지 않습니다
- 브로커
- 최소 예금
- 점수
- 브로커 방문


