
Buyers increases in number AUDUSD market
AUDUSD 価格分析 – 13 XNUMX 月
If buyers are determined enough to break through the $0.66 barrier, they might be able to push the price up to about $0.67 or even $0.68. If sellers are successful in driving AUDUSD below the $0.65 support level, the price may fall to the $0.64 and $0.63 support levels.
キーレベル:
抵抗レベル:$ 0.66、$ 0.67、$ 0.68
サポートレベル:$ 0.65、$ 0.64、$ 0.63
AUDUSD長期トレンド:強気
日足チャートは、 AUDUSD value is rising. On February 15, a large bullish candle developed, signaling the beginning of a bullish trend for the currency pair. The bears’ pressure caused a $0.63 drop in price. When sales started to gather up momentum, the price dropped to $0.63. At $0.66, a resistance level test was conducted. On February 22, it pulled back to challenge the $0.64 mark. The price is already approaching $0.66, which was the previous high.
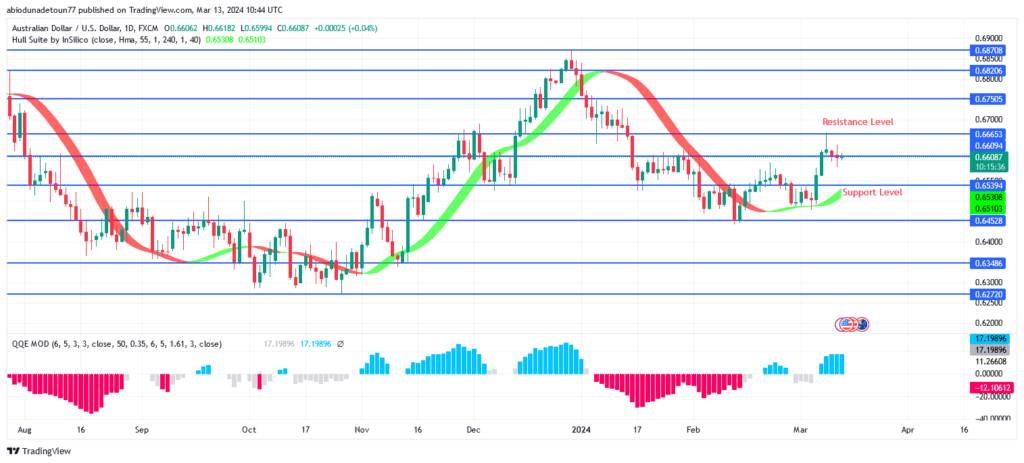
When the currency pair rises over the Hull Suite forex signals indicator, the market is considered bullish. A buy 外為信号 is displayed when the blue histogram of the QQE MOD indicator is above the zero level. If buyers are determined enough to break through the $0.66 barrier, they might be able to push the price up to about $0.67 or even $0.68. If sellers are successful in driving the price below the $0.65 support level, the price may fall to the $0.64 and $0.63 support levels.
AUDUSD中期トレンド:強気
The Australian dollar’s 4-hour chart shows an increasing trend. The $0.65 barrier level restrained the currency pair’s movement for over three weeks. Prices range from $0.64 to $0.63. This morning’s 4-hour candle closed below $0.65, and the chart showed a bullish candle. An upward trend is established if the level that was previously defined is breached.
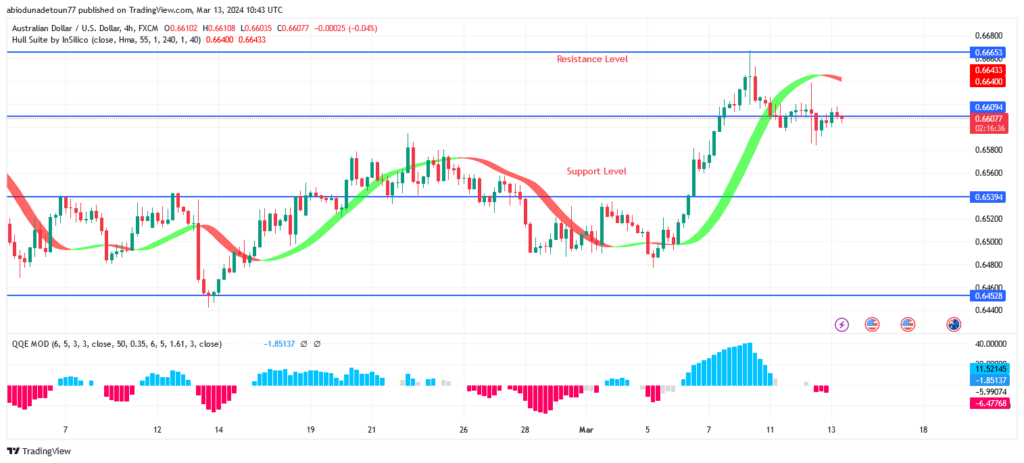
I believe there’s a possibility the AUDUSD market will continue to rise. The blue histogram and the QQE MOD, both of which are above zero, indicate a bullish trend.
ここでラッキーブロックを購入できます。 LBLOCKを購入する
- ブローカー
- 最低預金
- スコア
- ブローカーにアクセス


