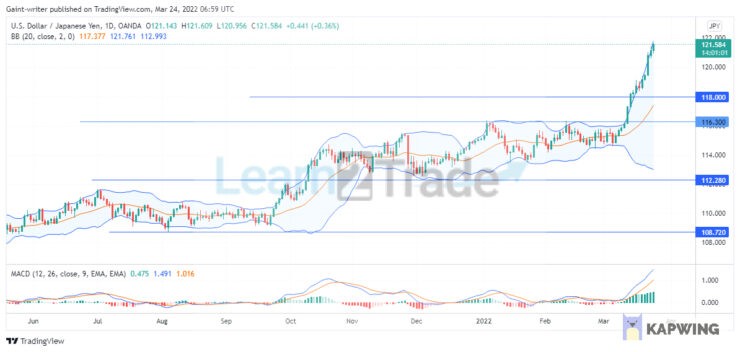
USDJPY continues its bullish streak, with prices surging above the 118.00 key level. The bulls’ pressure is assumed to increase due to buyers’ confidence to buy more positions at pending order blocks in the market. The buying pressure in the markets is likely to continue in the market for a moment while the price continues to soar to new highs in the market.
The market phased through a long-term accumulation at the key level of 108.720, a significant level in the market. As the market continues to accumulate, the Bollinger Band indicator squeezes the market. This compression, therefore, gives a breakout to the 112.280 price zone. Afterwards, the price is seen consolidating between the market levels of 112.280 and 116.300 from October 2021 to March 2022.
Furthermore, when the price rebounded from the middle level of the Bollinger Band channel in the USDJPY market, the bulls succeeded in pushing the price influence up above the 118.00 key point in the price action. Another price squeeze was displayed before the price broke through the 116.300 key level. The price will therefore continue to swing upward at the moment. The MACD (Moving Average Convergence) indicator shows the price trend is still soaring high in the market trend. The bulls are anticipating price action to continue bullish on the daily chart.
Ụdị obere oge USDJPY: Bullish
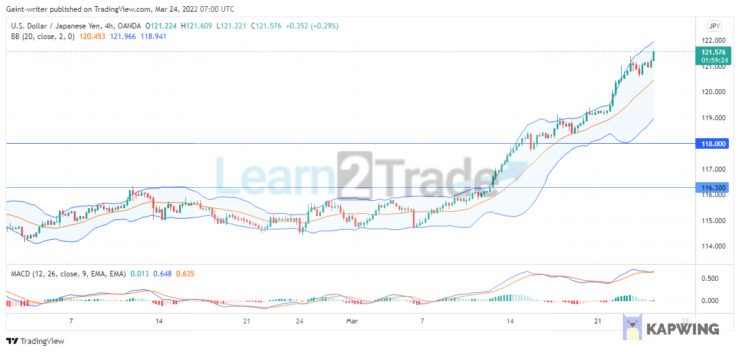
On the 4-hour chart, the price trend is settled and will continue in the bullish format. The market momentum continues to pull upward as the rice trend progresses. The MACD indicator is still moving above the 0.50 level in the market. The middle line of the Bolliger Band serves as a retest for the USDJPY market.
Cheta na:Muta2ihe abughi onye ndumodu ego. Mee nchọnchọ tupu itinye ego gị na aka akụ ọ bụla ma ọ bụ gosipụtara ngwaahịa ma ọ bụ ihe omume. Anyị ebughi ọrụ maka nsonaazụ itinye ego gị.
Azeez Mustapha bụ ọkachamara azụmaahịa, onye nyocha ego, onye na -ahụ maka akara, yana onye njikwa ego nwere ahụmịhe afọ iri n'ime ngalaba ego. Dị ka onye na -ede blọgụ na onye edemede ego, ọ na -enyere ndị na -etinye ego aka ịghọta echiche ego dị mgbagwoju anya, melite nkà itinye ego ha, na ịmụta ka esi ejikwa ego ha.