
Ọrụ maka ịzụ ahịa nnomi. Algo anyị na-emepe ma mechie azụmaahịa na-akpaghị aka.
L2T Algo na-enye akara ngosi bara uru nke ukwuu na obere ihe egwu.
24/7 ahia cryptocurrency. Mgbe ị na-ehi ụra, anyị na-azụ ahịa.
Nhazi nkeji 10 nwere nnukwu uru. Enyere akwụkwọ ntuziaka na ịzụrụ.
Ọnụego ịga nke ọma 79%. Nsonaazụ anyị ga-atọ gị ụtọ.
Ruo azụmaahịa 70 kwa ọnwa. Enwere ihe karịrị ụzọ abụọ ise dị.
Ndebanye aha kwa ọnwa na-amalite na £58.
Bulls will soon dominate BNBUSD Coin market soon
Nyocha ọnụahịa BNBUSD 30 June
The $276 resistance level can be broken on the upside, testing the $286 resistance level, if buyers can hold off against the $254 resistance level. Binance Coin may drop to its most recent lows of $219 and $200 if sellers get additional traction before closing below the $240 psychological level.
Ahịa BNB / USD
Nzọụkwụ isi:
Tụkwasịnụ ọkwa: $ 254, $ 276, $ 286
Nchọpụta ọkwa: $ 240, $ 219, $ 200
BNBUSD nddị ogologo oge: Bullish
On the daily chart, BNBUSD is Positive. The price action of the Binance Coin has formed a double-bottom chart pattern. This is a bullish reversal chart pattern formed at $219 support level. When Binance Coin tested the just mentioned level twice on 12 June and 28 June, a bullish trend may commence. Buyers may grab over as soon as the bulls intensify their pressure. For a few days, the price fluctuates within a small range of $219 and $239 levels. As the bullish trend grows stronger, pressure on the $254 level will rise.
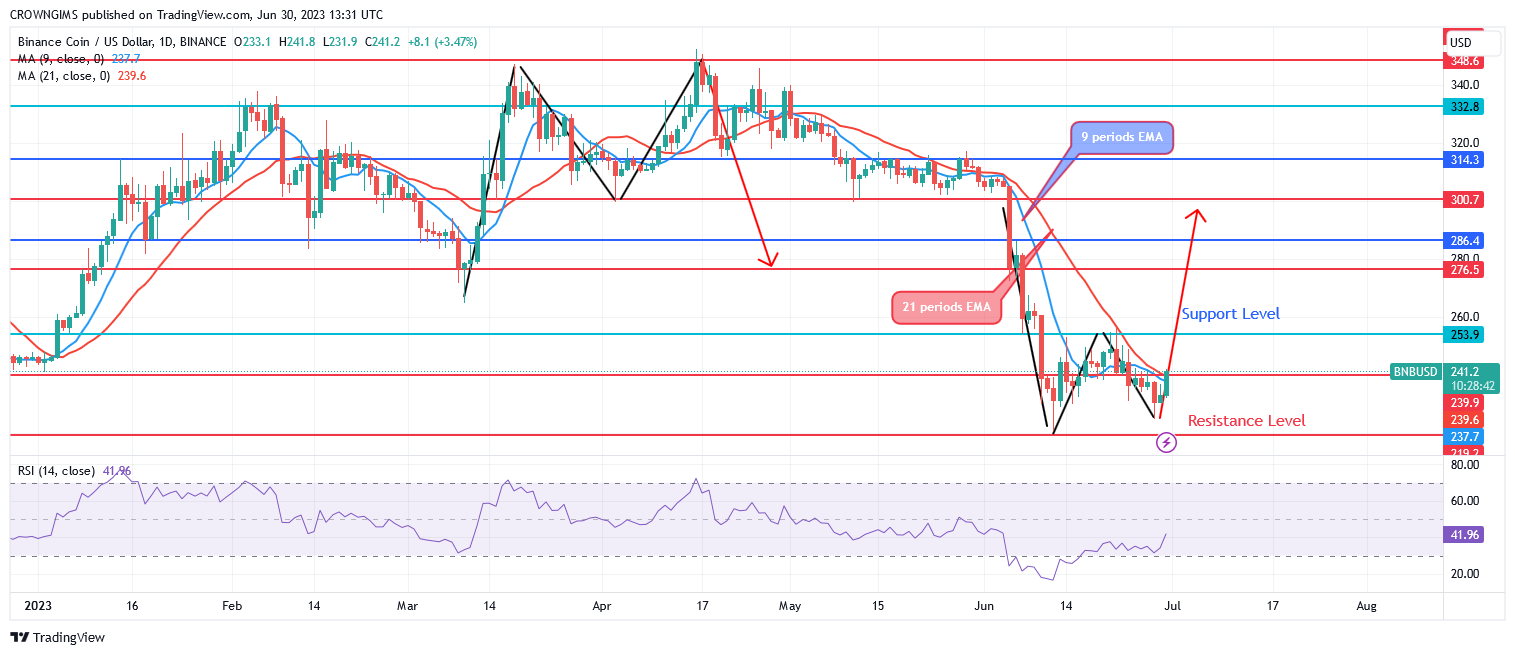
A bullish swing is indicated by the upward crossover of the 21-period EMA by the 9-period EMA. The price of the Binance Coin is trying to outperforming the two EMAs. The $276 resistance level can be broken on the upside, testing the $286 resistance level, if buyers can hold off against the $254 resistance level. Binance Coin may drop to its most recent lows of $219 and $200 if sellers get additional traction before closing below the $240 psychological level.
BNBUSD usoro-oge Trend: Bullish
On the four-hour chart, Binance Coin is on a bullish movement. At a price of $219 on June 12, the double bottom chart pattern initially appeared, signaling that buyers are about to take control of the market. The sellers’ interest decreased after the forced price test at the $253 barrier level. Prices are gradually increasing and are now close to $254 as customer demand has increased.
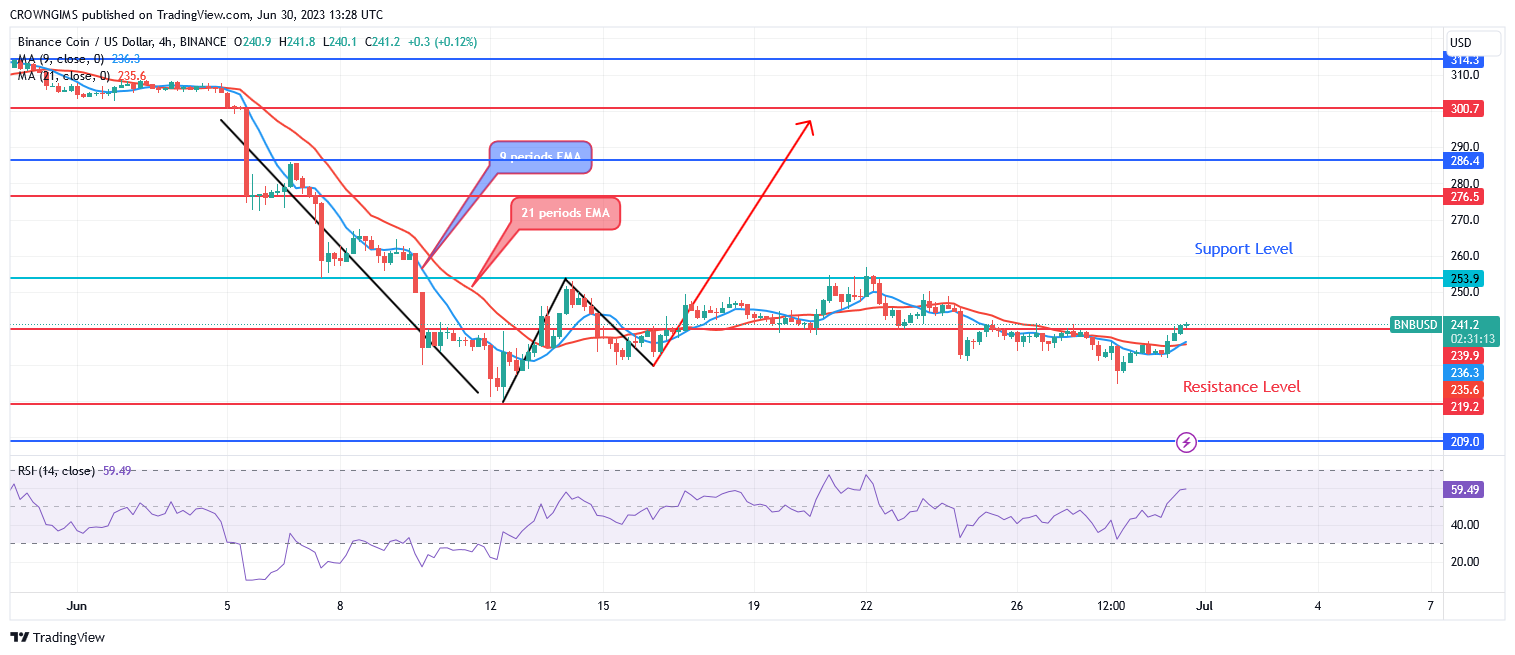
Indicating a bullish market, Binance Coin is now trading below the 9- and 21-period exponential moving averages. Relative strength index period 14 implies a sell when the signal line is pointing down at 46 levels which may be a pullback.
Ị nwere ike ịzụta Lucky Block ebe a. Zụrụ LBLOCK
- Broker
- Min ego
- Akara
- Nleta Broker

- Onyinye-emeri Cryptocurrency trading n'elu ikpo okwu
- $ 100 nkwụnye ego kacha nta,
- FCA & Cysec chịkwara

- 20% nabata ego nke ihe ruru $ 10,000
- Obere nkwụnye ego $ 100
- Nyochaa akaụntụ gị tupu daashi na-otoro

- N'ime 100 ngwaahịa ego dị iche iche
- Tinye ego na $ 10
- Withdrawalwepu otu ụbọchị ga-ekwe omume
- Ahịa Moneta Ahịa nwere akaụntụ opekata mpe $ 250
- Banye iji mpempe akwụkwọ iji kwuo ego nkwụnye ego 50% gị