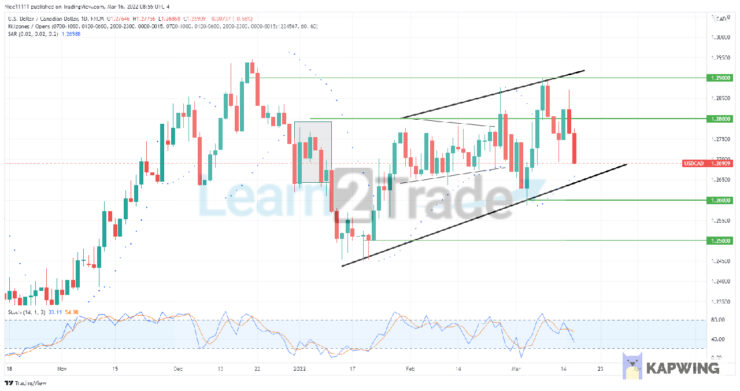
USDCAD bulls have failed to break the previous high on the daily timeframe. The market has been bullish since a reversal occurred in the market. A break in market structure was prominent in January. This caused a change in the market’s direction. The bulls utilized the demand zone at 1.250 to go long in the market. The market rose to the previous area of consolidation before the bearish impulse.
A symmetrical triangle was formed during February. On the 28th of January, a high was formed. The high paused the bullish impulsive move initiated at the previous demand zone at 1.250. The bulls failed to break the previous high formed on the 28th of January. Subsequently, each new high formed was lower than the previous. The market created lower highs and higher lows.
The 24th of February changed the narrative of the market. The high that was formed did not fail to break previous highs. All the earlier highs formed during February were cleared on the 24th of February. Similarly, February’s lows were cleared as the market dipped into the demand zone at 1.260. The bulls utilized the demand zone to go long, all the way to the upper border of the parallel channel. On the 8th of March, a new high was formed. The Stochastic indicator revealed that the market condition was overbought. This caused a drop in the market price.
USDCAD rövid távú trend: Bearish
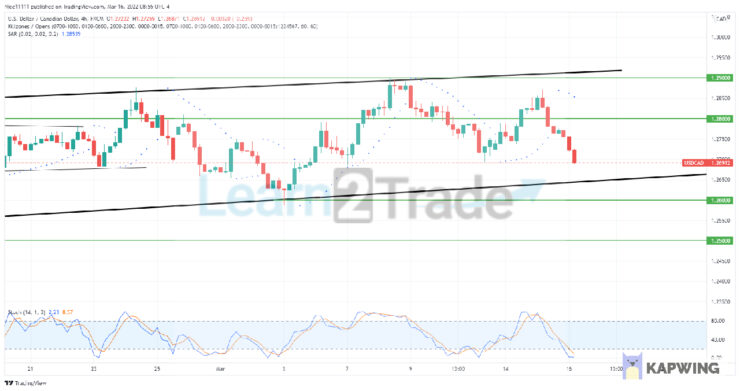
Just before reaching the lower border of the parallel channel, the bulls regained their momentum. On the four-hour chart, the Parabolic SAR signalled an increase in the market. On the 13th of March, a point was formed beneath the bullish candles, which caused the bullish motion. USDCAD bulls have failed to break the previous high. On the 15th of March, the Stochastic signalled the market was oversold. The market is currently running towards the lower border of the parallel channel. The lower boundary is just slightly above the demand zone at 1.260.
Jegyzet:megtanul2.kereskedelem nem pénzügyi tanácsadó. Mielőtt bármilyen pénzügyi eszközbe vagy bemutatott termékbe vagy eseménybe befektetne, végezzen kutatást. Nem vállalunk felelősséget a befektetési eredményekért.
Azeez Mustapha kereskedelmi szakember, valutaelemző, jelzőstratégia és alapkezelő, több mint tíz éves tapasztalattal rendelkezik a pénzügyi területen. Bloggerként és pénzügyi szerzőként segít a befektetőknek megérteni az összetett pénzügyi fogalmakat, fejleszteni befektetési készségeiket és megtanulni a pénzük kezelését.