
Ynvestearje net, útsein as jo ree binne om al it jild te ferliezen dat jo ynvestearje. Dit is in ynvestearring mei hege risiko en it is net wierskynlik dat jo beskerme wurde as der wat mis giet. Nim 2 minuten om mear te learen
Tsjinst foar kopiearjen hannel. Us Algo iepenet en slút hannels automatysk.
De L2T Algo leveret heul profitable sinjalen mei minimaal risiko.
24/7 cryptocurrency hannel. Wylst jo sliepe, hannelje wy.
10 minuten opset mei substansjele foardielen. De hânlieding wurdt foarsjoen mei de oankeap.
79% súkses rate. Us útkomsten sille jo opwekke.
Oant 70 hannelingen per moanne. D'r binne mear as 5 pearen beskikber.
Moanlikse abonneminten begjinne by £ 58.
Today, the BNT/USD price has increased by 2.49%. At this point, price action seems to have resumed its upside rally, which started on February 12. Currently, price action seems to be eyeing the resistance level of $0.6000. Let us examine the chances of this level being broken.
Bancor Analysis Data:
BNT wearde no: $0.5826
BNT market cap: $92 million
Bancor moving supply: 160 million
BNT Total Supply: 160 million
Bancor CoinMarketCap ranglist: #281
Wichtige priisnivo's:
Top: $0.5826, $0.5900 en $0.6000
Basis: $0.5800, $5755 en $0.5700
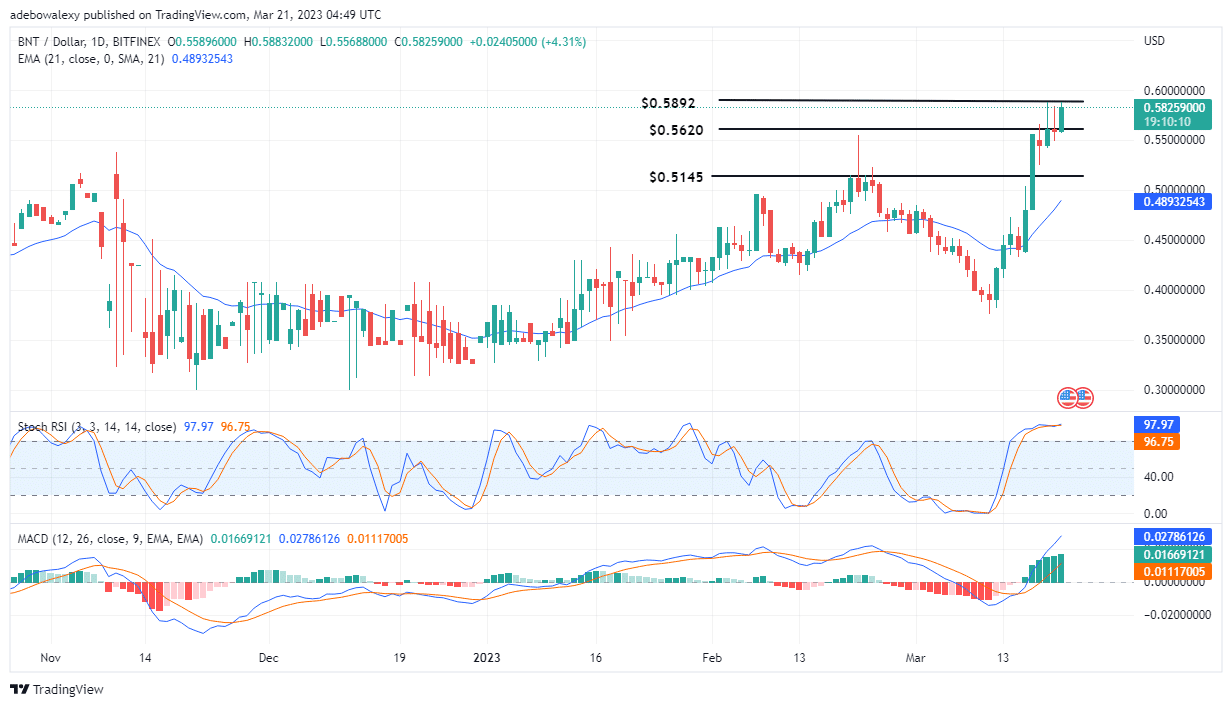
Bancor (BNT) Eyes the $0.6000 Price Resistance Level
The price candle on the BNT/USD daily chart keeps forming far above the 21-day EMA curve. The last price candle on this chart is a bullish one, and it has extended this crypto’s price above $0.5620. Meanwhile, the RSI indicator now indicates that price action is now in the oversold area. This can be perceived as the lines of this indicator being interwoven above level 90 of the indicator. Likewise, the MACD curves are now above the 0.00 point. Also, traders should note that the histogram bars are now appearing above the equilibrium point. Additionally, these bars seem taller than in recent times, and this aligns with other signs on this chart to support the possibilities of more upside price moves.
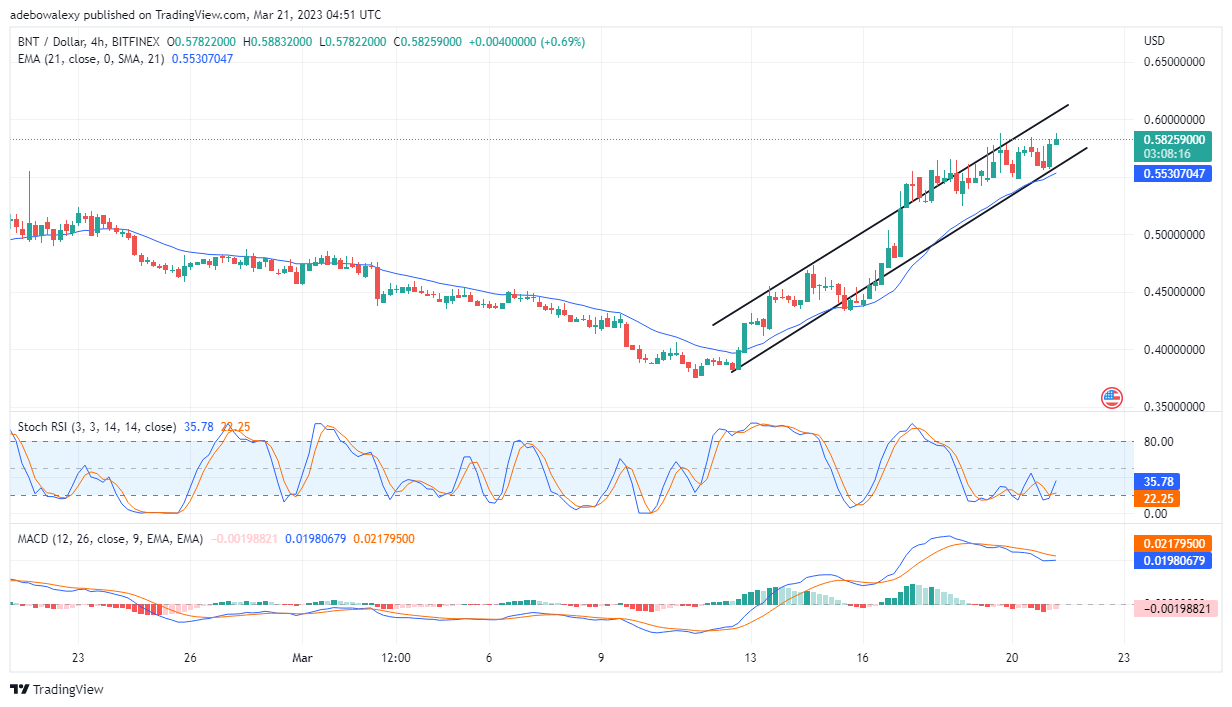
Bancor Price Retains an Upside Aim
Op 'e BNT/USD 4-hour market, trading activities have begun on another session under the control of the bulls. A green price candle has appeared just above the previous green one for the past session. The appearance of the most recent two bullish price candles has ended the downside price retracement of four sessions ago. At this point, the Stochastic RSI has given an upside crossover below the 40 levels of the indicator. Meanwhile, the lines of the MACD now move sideways above the 0.00 point. Therefore, traders can hope that Bancor’s price action may rise closer to the $0.6050 price mark.
- Broker
- Min boarchsom
- Skoare
- Besykje Broker

- Bekroand kryptovaluta-hannelsplatfoarm
- Minimale boarch fan $ 100,
- FCA & Cysec regele

- 20% wolkombonus fan maksimaal $ 10,000
- Minimale boarch $ 100
- Ferifiearje jo akkount foardat de bonus wurdt byskreaun

- Mear dan 100 ferskate finansjele produkten
- Ynvestearje fan mar $ 10
- Ynlûking fan deselde dei is mooglik
- Fûns Moneta Markets -akkount mei in minimum fan $ 250
- Meld jo oan mei it formulier om jo 50% boarchbonus op te easkjen