
Isevisi yokuhweba ngamakhophi. I-Algo yethu ivula futhi ivale ngokuzenzakalelayo ukuhweba.
I-L2T Algo inikeza amasiginali anenzuzo enkulu anengozi encane.
24/7 ukuhweba nge-cryptocurrency. Ngenkathi ulele, siyahweba.
Ukusethwa kwemizuzu eyi-10 okunezinzuzo ezinkulu. Imanuwali inikezwe ngokuthenga.
79% Izinga lempumelelo. Imiphumela yethu izokujabulisa.
Ukuhwebelana okungafika kuma-70 ngenyanga. Kunamapheya angaphezu kwama-5 atholakalayo.
Okubhaliselwe kwanyanga zonke kuqala ku-£58.
Ukuhlaziywa Kwentengo ye-ADA - Okthoba 20
Should the price test the resistance level at $0.11 and the daily candle close above it, then, $0.13 and $0.14 resistance levels may be tested. The inability to break up the $0.11 level by the bulls may trigger the bears to take over the ADA market.
Imakethe ye-ADA / USD
Amazinga wokhiye:
Amazinga okumelana nawo: $ 0.11, $ 0.13, $ 0.14
Amanqanaba wokusekela: $ 0.10, $ 0.08, $ 0.07
I-ADA / USD Trend Yesikhathi Eside: I-Bullish
The bulls are maintaining their bullish position in the ADA market. There are low volatility and low bullish momentum and that is why there was no significant difference in the last week’s market. ADA price observed a price retracement towards the dynamic support levels, the level prevents further price reduction. The price is slowly increasing towards the resistance level of $0.11.
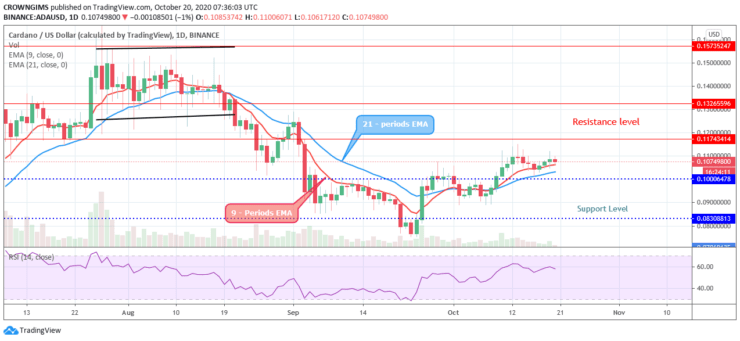
Cardano price continues trading above the 9 periods EMA and 21 periods EMA as a symbol of the bullish movement. The bulls may dominate the ADA market further as the moving averages are steep at an angle of 45 degrees with the formation of bullish candles. Should the price test the resistance level at $0.11 and the daily candle close above it, then, $0.13 and $0.14 resistance levels may be tested. The inability to break up the $0.11 level by the bulls may trigger the bears to take over the ADA market. Meanwhile, the relative strength index period 14 is at 60 levels and the signal line pointing down to indicate sell signal.
I-ADA / USD Trend yesikhathi esimaphakathi: Bullish
ADA/USD is bullish on the 4-hour chart. After the breakup of the $0.10 resistance level, the price steadily increases towards the $0.11 resistance level. The price pulls back to the dynamic support level and it is consolidating around the dynamic levels.
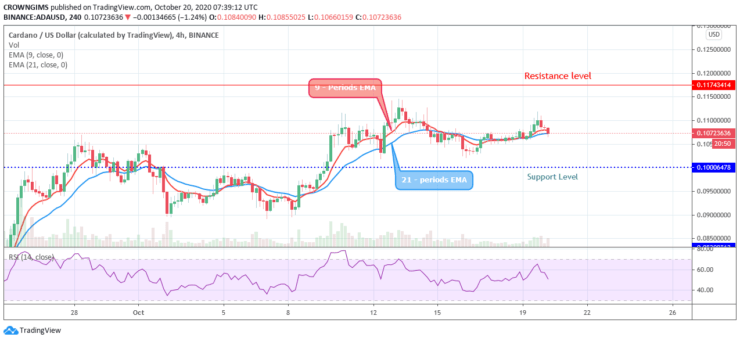
The Relative Strength Index period 14 with its signal line at 50 levels bending down to indicate sell signal. The price may increase further after the pullback.
- broker
- Min Deposit
- Umphumela
- Vakashela Broker

- Ipulatifomu yokuhweba ye-Cryptocurrency ewina umklomelo
- $ 100 idiphozi encane,
- I-FCA ne-Cysec kulawulwa

- 20% wamukelekile ibhonasi efinyelela ku- $ 10,000
- Idiphozi encane $ 100
- Qinisekisa i-akhawunti yakho ngaphambi kokufakwa kwebhonasi

- Imikhiqizo yezimali eyehlukene engaphezu kwe-100
- Faka imali kusuka ku- $ 10 okuncane
- Ukuhoxiswa kosuku olufanayo kungenzeka
- Izindleko Zokuhweba Eziphansi Kakhulu
- I-50% Ibhonasi Yemukeli
- Ukusekelwa kwamahora angama-24 okuwinile
- I-akhawunti Yezimakethe Zemali Yezimali enenani eliphansi lama- $ 250
- Khetha ukusebenzisa ifomu ukufaka isicelo sakho sebhonasi engu-50%