
Iṣẹ fun daakọ iṣowo. Algo wa yoo ṣii laifọwọyi ati tilekun awọn iṣowo.
L2T Algo n pese awọn ifihan agbara ere pupọ pẹlu eewu kekere.
24/7 iṣowo cryptocurrency. Nigba ti o sun, a isowo.
Iṣeto iṣẹju 10 pẹlu awọn anfani nla. Iwe itọnisọna ti pese pẹlu rira.
Oṣuwọn aṣeyọri 79%. Awọn abajade wa yoo dun ọ.
Titi di awọn iṣowo 70 fun oṣu kan. Nibẹ ni o wa siwaju sii ju 5 orisii wa.
Ṣiṣe alabapin oṣooṣu bẹrẹ ni £ 58.
Bears’ momentum increase in USDCHF market
USDCHF Price Analysis - 20 Kẹsán
When buyers’ momentum is successful in holding the $0.88 support level, the price may move past the $0.89 resistance level and toward the $0.90 and $0.91 resistance levels. If sellers apply sufficient pressure, the $0.88 barrier level may be broken, leading to a significant drop in price towards the $0.87 and $0.86 levels.
USDCHF ọja
Awọn ipele bọtini:
Awọn ipele iduro: $ 0.89, $ 0.90, $ 0.91
Awọn ipele atilẹyin: $ 0.88, $ 0.87, $ 0.86
USDCHF Aṣa igba pipẹ: Bearish
On the daily chart, USDCHF is bearish. At the moment, the USDCHF is decreasing and is not having trouble falling below the $0.89 barrier. The USDCHF oja has been dominated by sellers throughout the last week. When the price broke through the support level of $0.90, the currency pair established a downtrend. A bearish trend started when a double top chart pattern emerged. The USDCHF is moving down, approaching $0.88.
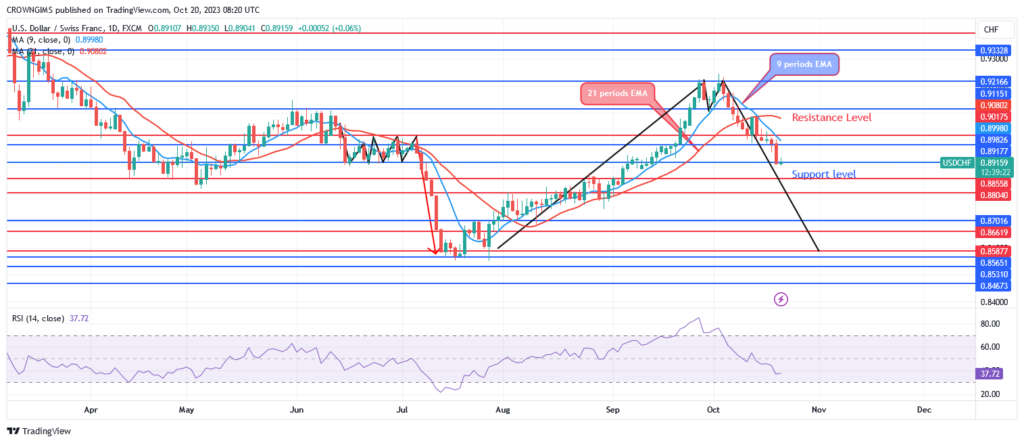
The price of the USD/CHF is currently below the 21- and 9-period moving averages, indicating that the selling momentum may be increasing. The Relative Strength Index period 14 at 51 levels indicates a bearish market. If buyers’ momentum is successful in holding the $0.88 support level, the price may move past the $0.89 resistance level and toward the $0.90 and $0.91 resistance levels. If sellers apply sufficient pressure, the $0.88 barrier level may be broken, leading to a significant drop in price towards the $0.87 and $0.86 levels.
USDCHF Aṣa Alabọde-igba: Bearish
From a mid-term standpoint, USDCHF is trending downward. The formation of a double-top chart pattern near the $0.92 resistance level signals the start of a bearish trend for the currency pair. Bearish candles are the product of market forces. On October 12, the $0.90 support level was put to the test. It retreated the next day. Currently, sellers’ momentum is increasing and it is targeting a $0.88 support level.
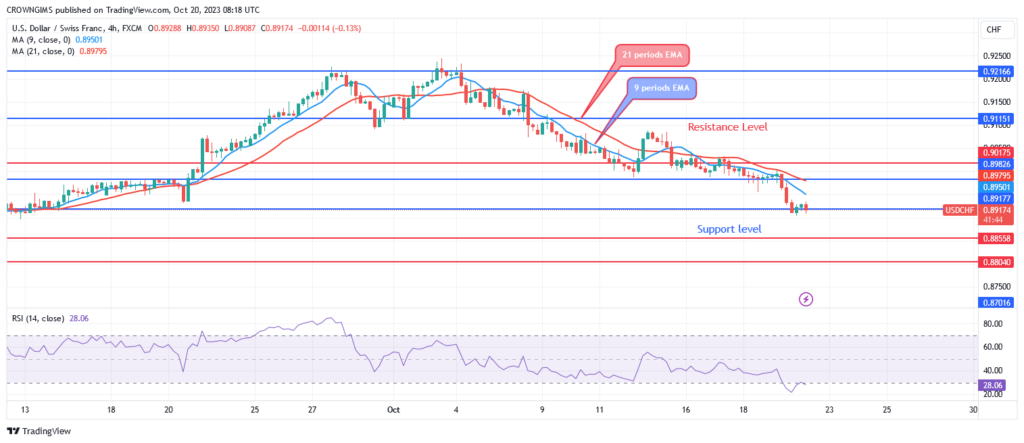
The fact that the currency pair is trading below both the 21- and 9-period exponential moving averages suggests a bearish market. The Relative Strength Index period 14 signal line is going downward, suggesting a sell, and the index is currently at 36.
O le ra Lucky Block nibi. Ra LBLOCK
- alagbata
- Idogo min
- O wole
- Ṣabẹwo si Broker

- Syeed iṣowo Cryptocurrency ti o gba ẹbun
- $ 100 idogo to kere ju,
- FCA & Cysec ṣe ilana

- 20% kaabo ajeseku ti to $ 10,000
- Idogo ti o kere ju $ 100
- Daju iroyin rẹ ṣaaju ki o to ka ajeseku

- Lori awọn ọja inawo oriṣiriṣi 100
- Ṣe idoko-owo lati diẹ bi $ 10
- Yiyọ ọjọ kanna ṣee ṣe
- Iṣiro Awọn ọja Iṣowo Moneta pẹlu o kere ju $ 250
- Jade ni lilo fọọmu lati beere fun idogo idogo 50% rẹ