
Iṣẹ fun daakọ iṣowo. Algo wa yoo ṣii laifọwọyi ati tilekun awọn iṣowo.
L2T Algo n pese awọn ifihan agbara ere pupọ pẹlu eewu kekere.
24/7 iṣowo cryptocurrency. Nigba ti o sun, a isowo.
Iṣeto iṣẹju 10 pẹlu awọn anfani nla. Iwe itọnisọna ti pese pẹlu rira.
Oṣuwọn aṣeyọri 79%. Awọn abajade wa yoo dun ọ.
Titi di awọn iṣowo 70 fun oṣu kan. Nibẹ ni o wa siwaju sii ju 5 orisii wa.
Ṣiṣe alabapin oṣooṣu bẹrẹ ni £ 58.
US30 price action received a significant upside push last Friday. However, the market opened for the week attracting the attention of bears. Subsequently, this has caused prices to keep falling toward the support level of $33,411. In today’s session, prices may likely break this support level to reach lower.
Awọn ipele idiyele pataki:
Awọn ipele oke: $33,441, $33,500, $33,560
Awọn ipele Ilẹ: $ 33411, $ 33,388, $ 33,350
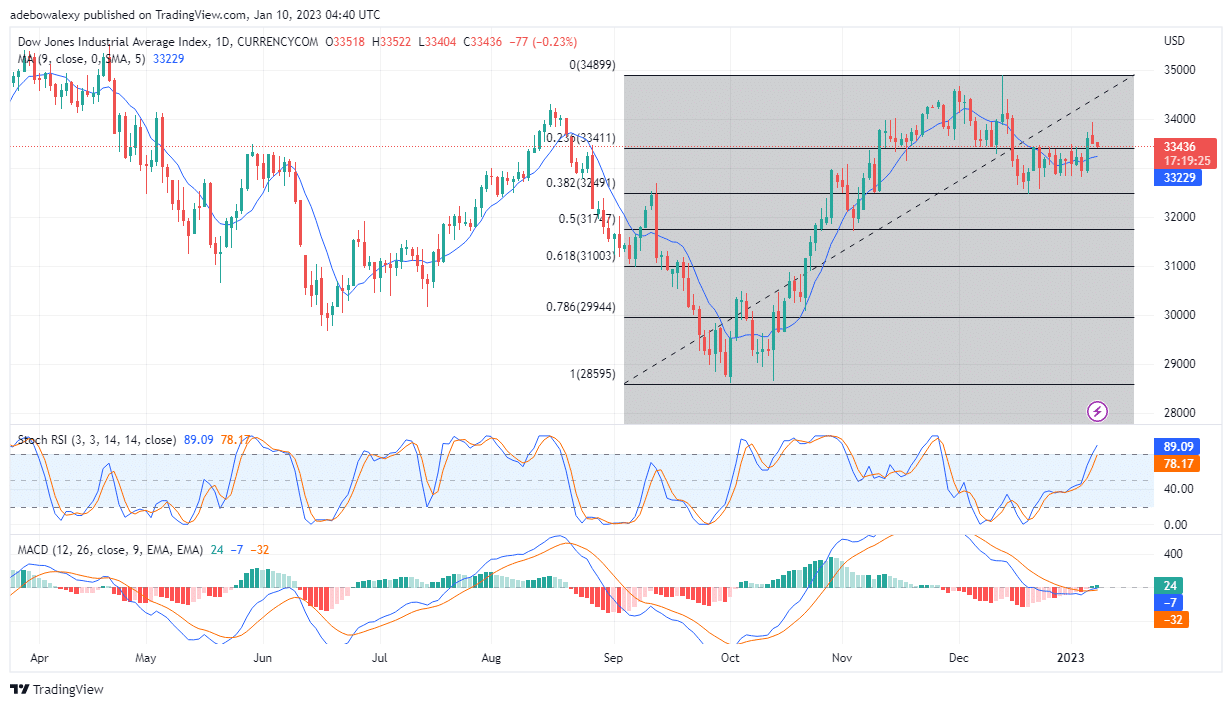
US30 Price Action and Technical Indicator Stays Divergent
Owo akitiyan lori awọn US30 daily market are now trickling down towards an important support level, that aligns with the Fibonacci level of 23.60. Also, the price candle representing today’s trading session is almost bringing the market to the above-mentioned price mark. Nevertheless, technical indicators are revealing that the price is still on its way up. The lines on the Stochastic RSI are rising into the overbought region and nearly reaching the 90 mark. Furthermore, the histogram bars on the MACD are now green and forming above the 0.00 mark to indicate a developing upsurge in price. Nevertheless, it is expedient that traders carry out further checks on price action before making trading decisions at this point.
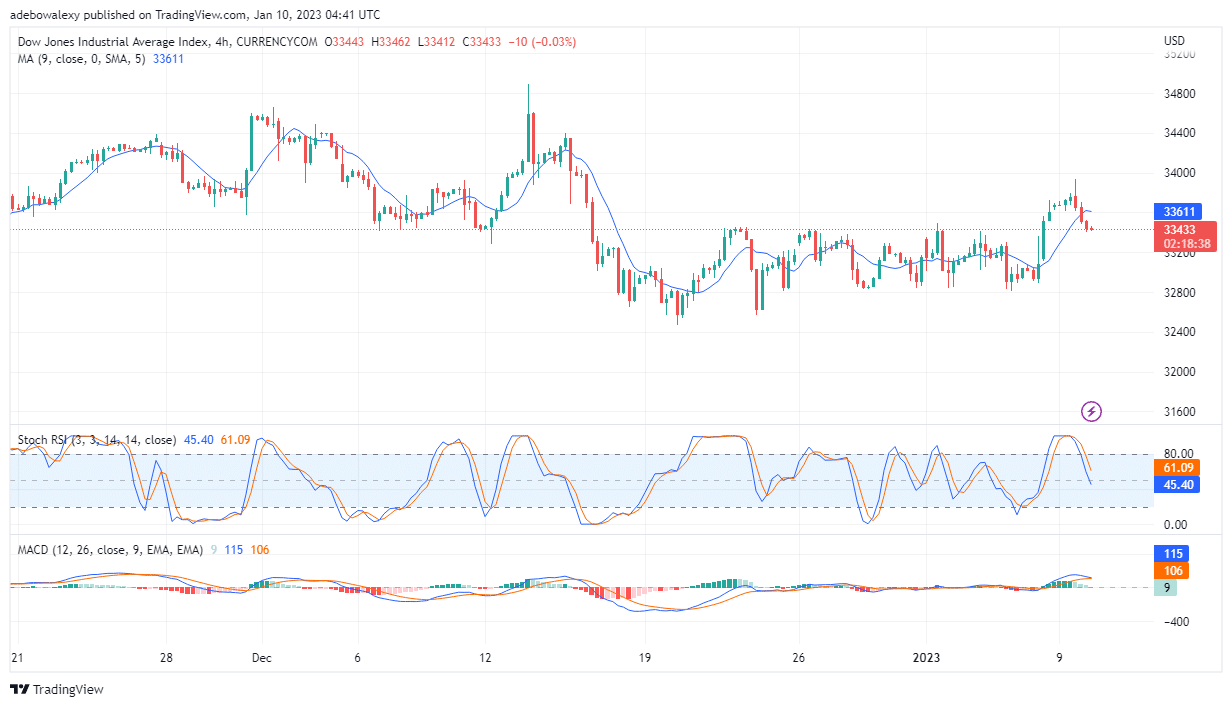
US30 May Have Started a Downtrend
Examining US30 price activities on the 4-hour chart, it could be seen that price candles have fallen below the Moving Average curve. Technically, such a display indicates that the price is in a downtrend. Furthermore, the Stochastic RSI shares the same opinion. This could be observed as the lines of this indicator are now coursing towards the oversold region. Likewise, the MACD indicator is now about to give a crossover to indicate the resumption of downward forces. Consequently, the 4-hour chart is revealing that the price may continue to fall lower as trading activities continue. Therefore, traders can predict that the price may fall to nearly $33,350.
Ṣe o fẹ lati mu iṣowo rẹ lọ si ipele ti atẹle? Darapọ mọ pẹpẹ ti o dara julọ fun iyẹn nibi.
- alagbata
- Idogo min
- O wole
- Ṣabẹwo si Broker

- Syeed iṣowo Cryptocurrency ti o gba ẹbun
- $ 100 idogo to kere ju,
- FCA & Cysec ṣe ilana

- 20% kaabo ajeseku ti to $ 10,000
- Idogo ti o kere ju $ 100
- Daju iroyin rẹ ṣaaju ki o to ka ajeseku

- Lori awọn ọja inawo oriṣiriṣi 100
- Ṣe idoko-owo lati diẹ bi $ 10
- Yiyọ ọjọ kanna ṣee ṣe
- Iṣiro Awọn ọja Iṣowo Moneta pẹlu o kere ju $ 250
- Jade ni lilo fọọmu lati beere fun idogo idogo 50% rẹ