
Iṣẹ fun daakọ iṣowo. Algo wa yoo ṣii laifọwọyi ati tilekun awọn iṣowo.
L2T Algo n pese awọn ifihan agbara ere pupọ pẹlu eewu kekere.
24/7 iṣowo cryptocurrency. Nigba ti o sun, a isowo.
Iṣeto iṣẹju 10 pẹlu awọn anfani nla. Iwe itọnisọna ti pese pẹlu rira.
Oṣuwọn aṣeyọri 79%. Awọn abajade wa yoo dun ọ.
Titi di awọn iṣowo 70 fun oṣu kan. Nibẹ ni o wa siwaju sii ju 5 orisii wa.
Ṣiṣe alabapin oṣooṣu bẹrẹ ni £ 58.
Bearish pressure may further increase in S&P 500 market
S & P 500 Iye Ayẹwo - 27 Kejìlá
If the selling pressure picks up, the S&P 500 may breach the $3740 support level, and more pressure from the sellers could drive the price down to $3649 and $3493 levels. Price may reverse and rise toward the resistance levels of $3926, $4087, and $4169 if the support level of $3740 holds
Awọn ipele bọtini:
Awọn ipele iduro: $ 3926, $ 4087, $ 4169
Awọn ipele atilẹyin: $ 3740, $ 3649, $ 3493
S&P 500 Aṣa gigun: Bearish
On the daily chart, the S&P 500 is bearish. When the price surpassed the $4087 barrier mark, the bulls lost their momentum. At the aforementioned level, a minor double-top chart pattern developed; this is a sign that sellers are prepared to take control of the market. The price breached the $3926 support level as the sellers’ pressure grew. Currently, $3740 is being targeted as a support level.
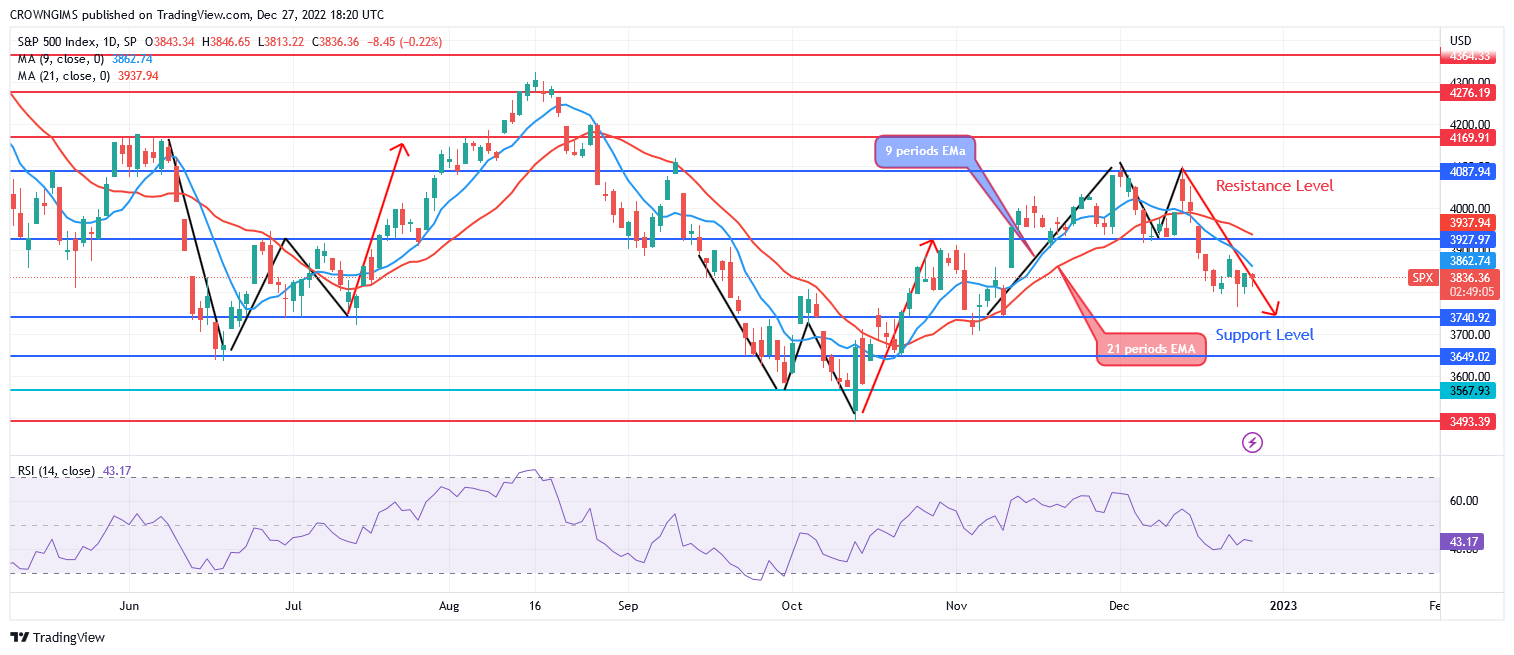
The S&P 500 is trading below both the 9- and 21-period exponential moving averages, which point to bearish momentum. If the selling pressure picks up, the S&P 500 may breach the $3740 support level, and more pressure from the sellers could drive the price down to $3649 and $3493 levels. Price may reverse and rise toward the resistance levels of $3926, $4087, and $4169 if the support level of $3740 holds. With the signal line heading downward and the relative strength index period 14 at 42, a sell signal is being indicated.
S&P 500 Aṣa Alabọde-igba: Bearish
The S&P 500 is moving bearishly according to the prognosis on the 4-hour chart. In the 4-hour time window, the price movement created an “M” chart pattern. The resistance level of $4087 was reached by the price. The support level of $3937, which it had previously tested, has held. The bearish chart pattern that formed is giving the price direction.
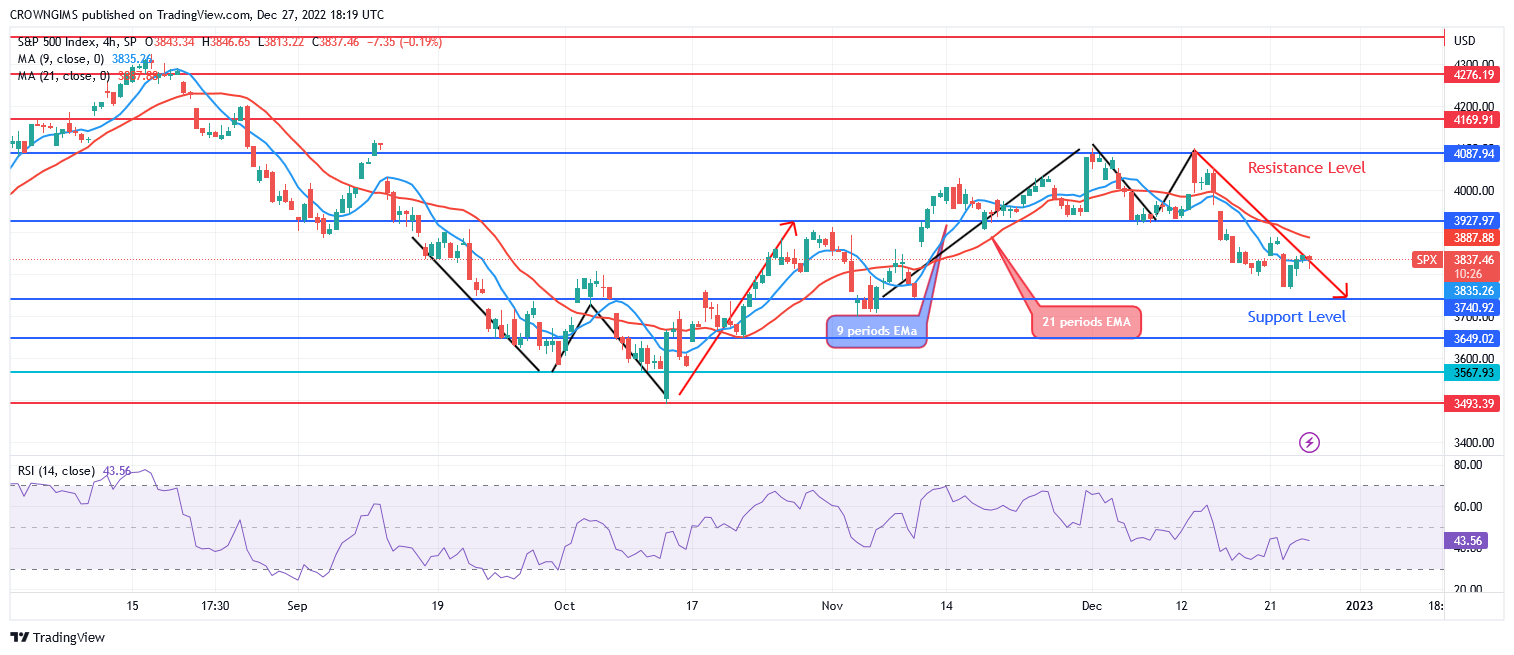
The price is moving in a bearish direction because it is trading below both the 9- and 21-period exponential moving averages. A bearish signal can be seen in the relative strength index period 14 at 41 levels.
O le ra Lucky Block nibi. Ra LBLOCK
- alagbata
- Idogo min
- O wole
- Ṣabẹwo si Broker

- Syeed iṣowo Cryptocurrency ti o gba ẹbun
- $ 100 idogo to kere ju,
- FCA & Cysec ṣe ilana

- 20% kaabo ajeseku ti to $ 10,000
- Idogo ti o kere ju $ 100
- Daju iroyin rẹ ṣaaju ki o to ka ajeseku

- Lori awọn ọja inawo oriṣiriṣi 100
- Ṣe idoko-owo lati diẹ bi $ 10
- Yiyọ ọjọ kanna ṣee ṣe
- Iṣiro Awọn ọja Iṣowo Moneta pẹlu o kere ju $ 250
- Jade ni lilo fọọmu lati beere fun idogo idogo 50% rẹ