
Iṣẹ fun daakọ iṣowo. Algo wa yoo ṣii laifọwọyi ati tilekun awọn iṣowo.
L2T Algo n pese awọn ifihan agbara ere pupọ pẹlu eewu kekere.
24/7 iṣowo cryptocurrency. Nigba ti o sun, a isowo.
Iṣeto iṣẹju 10 pẹlu awọn anfani nla. Iwe itọnisọna ti pese pẹlu rira.
Oṣuwọn aṣeyọri 79%. Awọn abajade wa yoo dun ọ.
Titi di awọn iṣowo 70 fun oṣu kan. Nibẹ ni o wa siwaju sii ju 5 orisii wa.
Ṣiṣe alabapin oṣooṣu bẹrẹ ni £ 58.
Bearish pressure may increase in S&P 500 market
S & P 500 Iye Ayẹwo - 20 Kejìlá
In case the momentum of the sellers increase, S & P 500 may break down the support level of $3740, and a further increase in sellers’ pressure may reduce the price to $3649 and $3493 levels. Should the support level of $3740 holds, the price can reverse and increase toward the resistance levels of $3926, $4087, and $4169.
Awọn ipele bọtini:
Awọn ipele iduro: $ 3926, $ 4087, $ 4169
Awọn ipele atilẹyin: $ 3740, $ 3649, $ 3493
S&P 500 Aṣa gigun: Bearish
S&P 500 is bearish on the daily chart. The bulls could not maintain their momentum when the price reached the resistance level of $4087. A small double-top chart pattern formed at the mentioned level; is an indication that sellers are ready to dominate the market. The sellers’ pressure increased and the price penetrated the support level of $3926. It is currently targeting the support level of $3740.
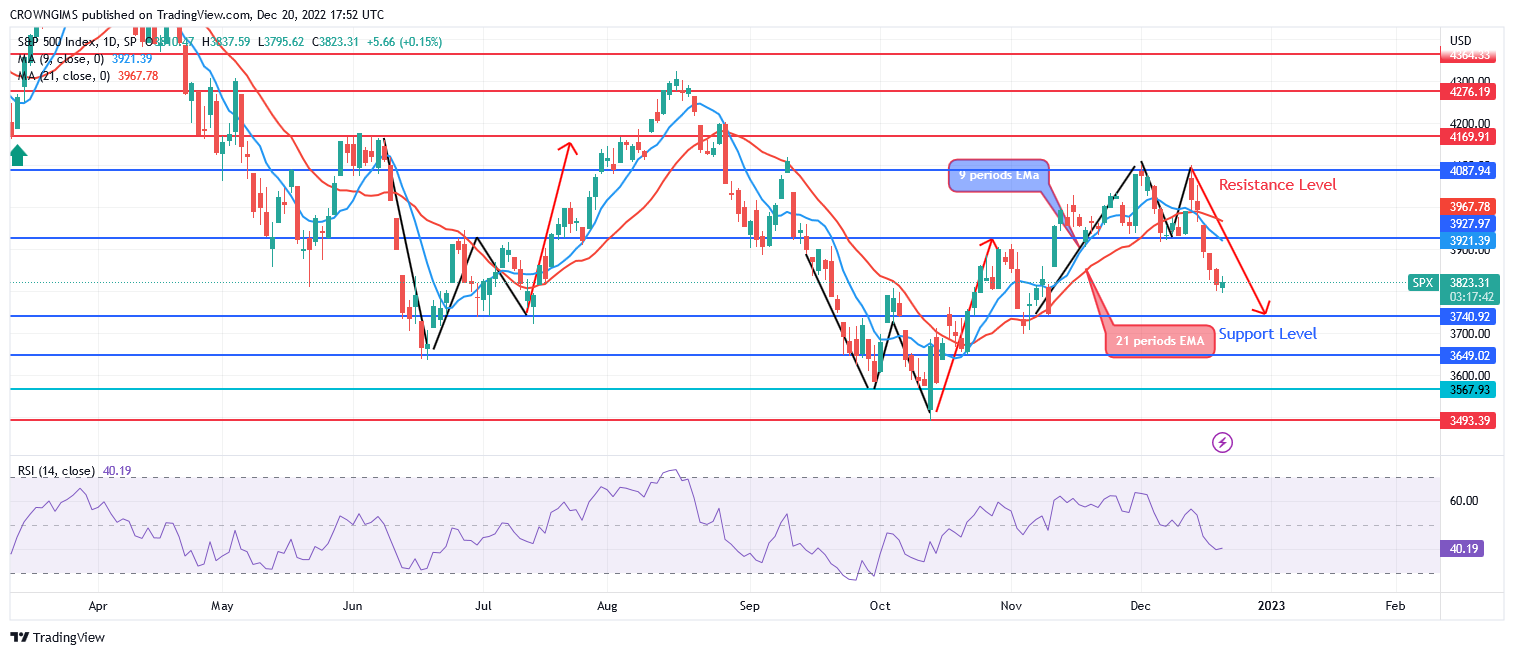
S&P 500 is trading below the 9-periods EMA and the 21-period EMA which indicates bearish momentum. In case the momentum of the sellers increase, S&P 500 may break down the support level of $3740, and a further increase in sellers’ pressure may reduce the price to $3649 and $3493 levels. Should the support level of $3740 holds, the price can reverse and increase toward the resistance levels of $3926, $4087 and $4169. The relative strength index period 14 is at 40 levels with the signal line pointing down to indicate a sell signal.
S&P 500 Aṣa Alabọde-igba: Bearish
S&P 500 is on a bearish movement in the 4-hour chart outlook. The price action formed an “M” chart pattern in the 4-hour time frame. The price increased to the resistance level of $4087. It pulled back to retest the support level of $3937, the just mentioned level holds. The price is obeying the command from the bearish chart pattern formed. 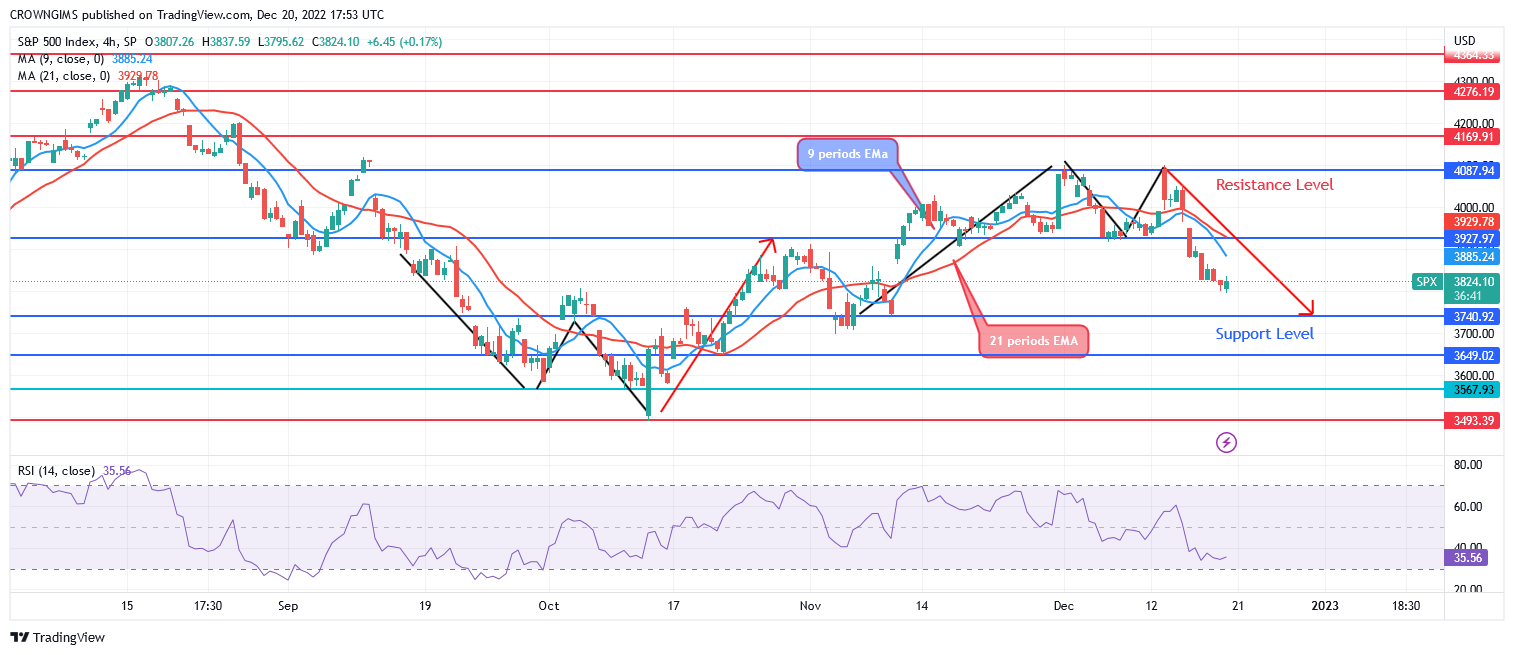
The price is trading below the 9-periods EMA and 21-periods EMA as an indication of bearish movement. The relative strength index period 14 is at 35 levels displaying a bearish signal.
O le ra Lucky Block nibi. Ra LBLOCK
- alagbata
- Idogo min
- O wole
- Ṣabẹwo si Broker

- Syeed iṣowo Cryptocurrency ti o gba ẹbun
- $ 100 idogo to kere ju,
- FCA & Cysec ṣe ilana

- 20% kaabo ajeseku ti to $ 10,000
- Idogo ti o kere ju $ 100
- Daju iroyin rẹ ṣaaju ki o to ka ajeseku

- Lori awọn ọja inawo oriṣiriṣi 100
- Ṣe idoko-owo lati diẹ bi $ 10
- Yiyọ ọjọ kanna ṣee ṣe
- Iṣiro Awọn ọja Iṣowo Moneta pẹlu o kere ju $ 250
- Jade ni lilo fọọmu lati beere fun idogo idogo 50% rẹ