
Iṣẹ fun daakọ iṣowo. Algo wa yoo ṣii laifọwọyi ati tilekun awọn iṣowo.
L2T Algo n pese awọn ifihan agbara ere pupọ pẹlu eewu kekere.
24/7 iṣowo cryptocurrency. Nigba ti o sun, a isowo.
Iṣeto iṣẹju 10 pẹlu awọn anfani nla. Iwe itọnisọna ti pese pẹlu rira.
Oṣuwọn aṣeyọri 79%. Awọn abajade wa yoo dun ọ.
Titi di awọn iṣowo 70 fun oṣu kan. Nibẹ ni o wa siwaju sii ju 5 orisii wa.
Ṣiṣe alabapin oṣooṣu bẹrẹ ni £ 58.
Onínọmbà Iye S & P 500 - Oṣu Kẹjọ 23
S&P 500 may penetrate support level at $4087 downside, there will be a further decrease in price towards $3927 and $3740 levels. Above the price at the moment are resistance levels at $4169, $4276, and $4364.
Awọn ipele bọtini:
Awọn ipele iduro: $ 4169, $ 4276, $ 4364
Awọn ipele atilẹyin: $ 4087, $ 3927, $ 3740
S&P 500 Aṣa gigun: Bearish
S&P 500 is bearish on the daily chart. The S&P 500 market was controlled by the bulls for more than ten days. The bullish momentum broke up the former resistance level of $4087 and placed the price at $4276 level. The bullish momentum became weak and the bears defended the mentioned level. The price decreases and turned south. The price is currently trading below $4169 level.
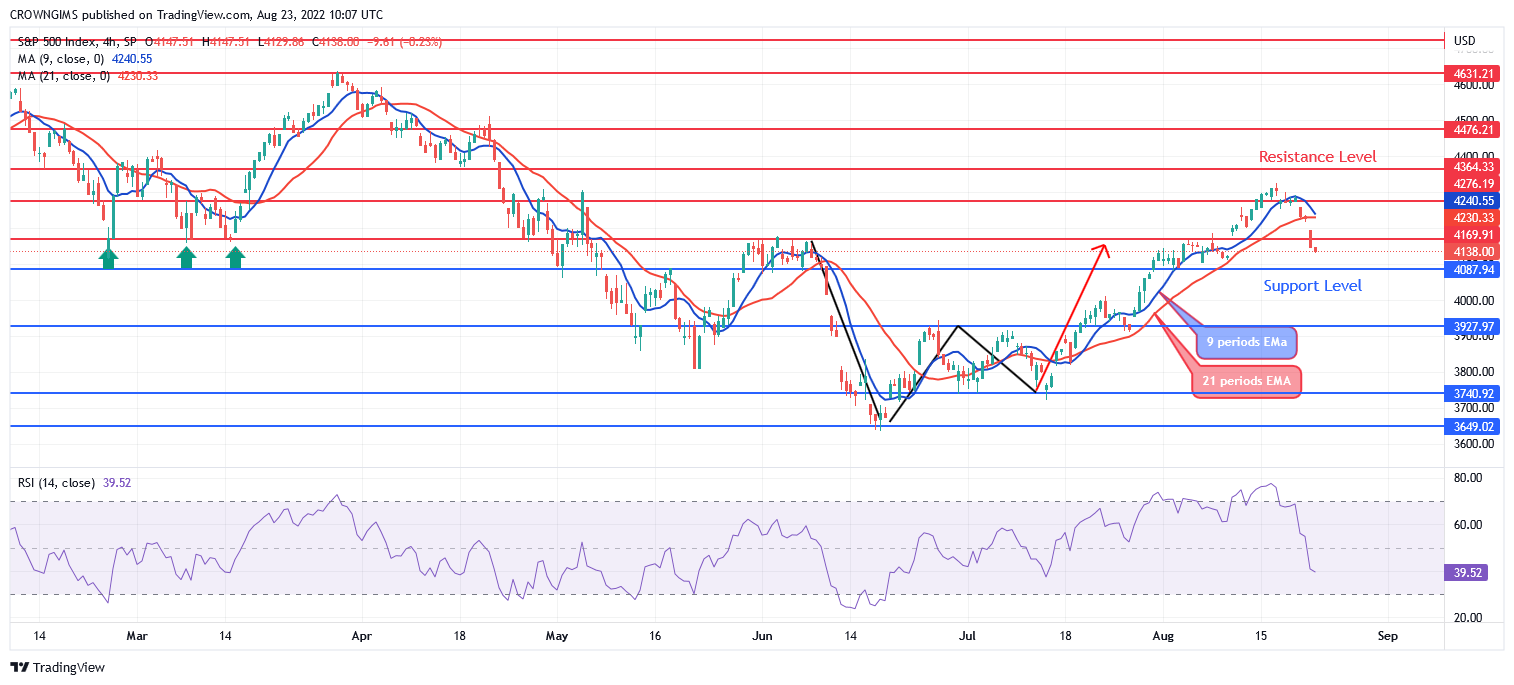
S&P 500 is trading below the 9 periods EMA and the 21 periods EMA which indicate an increase in the sellers’ momentum. When bears’ momentum increase, S&P 500 may penetrate support level at $4087 downside, there will be a further decrease in price towards $3927 and $3740 levels. Above the price at the moment are resistance levels at $4169, $4276, and $4364. However, the relative strength index period 14 is at 51 levels with the signal lines pointing downside to indicate sell signal.
S&P 500 Aṣa Alabọde-igba: Bearish
S&P 500 is on the bearish movement on the 4-hour chart outlook. The bulls still dominated the market till last week. The bulls steadily follow the direction of the bullish chart pattern; “Double bottom” formed in 4 hour time frame. The price was heading towards $4364 level but could not reach the mark before bears interrupts the bullish movement.
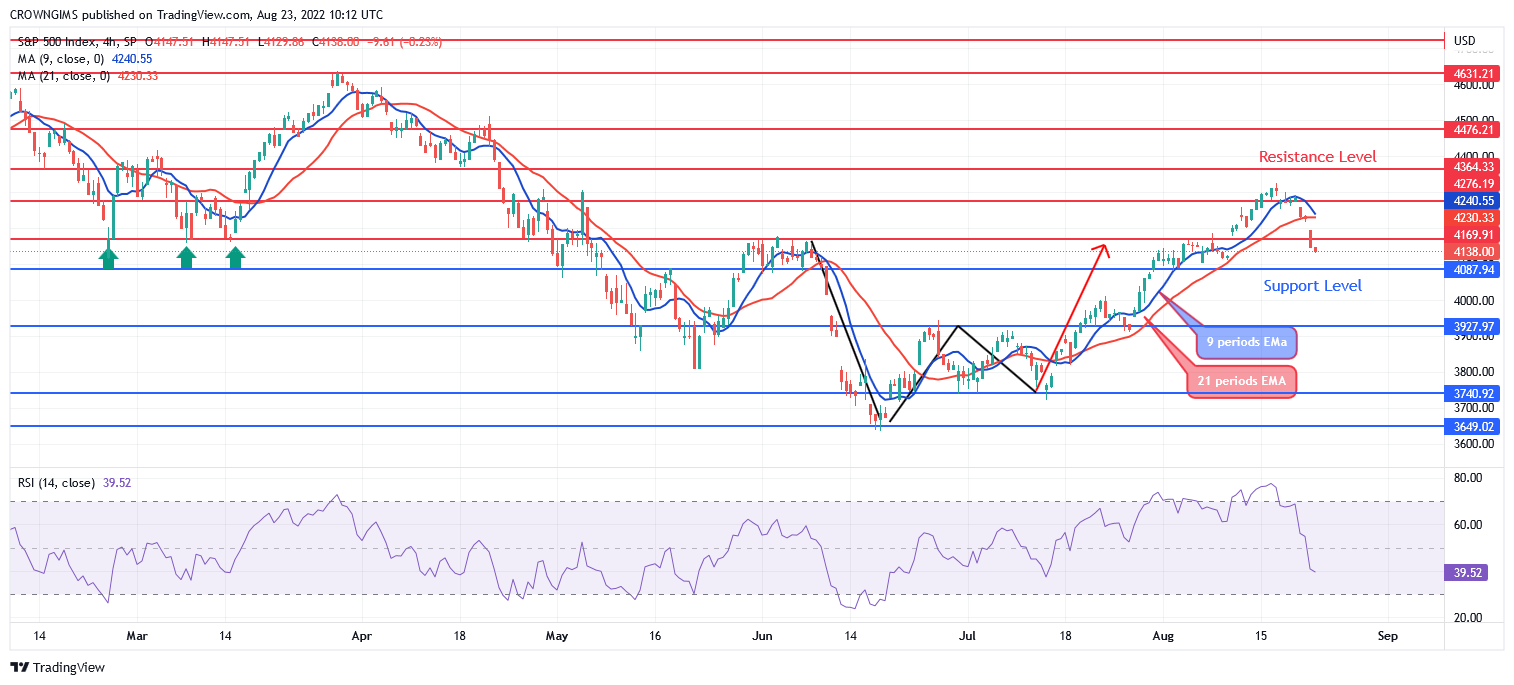
The price is trading below the 9 periods EMA and 21 periods EMA as an indication of bearish movement. The relative strength index period 14 is at 39 levels bending down displaying bearish signal.
O le ra Lucky Block nibi. Ra LBLOCK
- alagbata
- Idogo min
- O wole
- Ṣabẹwo si Broker

- Syeed iṣowo Cryptocurrency ti o gba ẹbun
- $ 100 idogo to kere ju,
- FCA & Cysec ṣe ilana

- 20% kaabo ajeseku ti to $ 10,000
- Idogo ti o kere ju $ 100
- Daju iroyin rẹ ṣaaju ki o to ka ajeseku

- Lori awọn ọja inawo oriṣiriṣi 100
- Ṣe idoko-owo lati diẹ bi $ 10
- Yiyọ ọjọ kanna ṣee ṣe
- Iṣiro Awọn ọja Iṣowo Moneta pẹlu o kere ju $ 250
- Jade ni lilo fọọmu lati beere fun idogo idogo 50% rẹ