
Iṣẹ fun daakọ iṣowo. Algo wa yoo ṣii laifọwọyi ati tilekun awọn iṣowo.
L2T Algo n pese awọn ifihan agbara ere pupọ pẹlu eewu kekere.
24/7 iṣowo cryptocurrency. Nigba ti o sun, a isowo.
Iṣeto iṣẹju 10 pẹlu awọn anfani nla. Iwe itọnisọna ti pese pẹlu rira.
Oṣuwọn aṣeyọri 79%. Awọn abajade wa yoo dun ọ.
Titi di awọn iṣowo 70 fun oṣu kan. Nibẹ ni o wa siwaju sii ju 5 orisii wa.
Ṣiṣe alabapin oṣooṣu bẹrẹ ni £ 58.
Trading activities for last week ended with price action recovering from the losses that were recorded on Wednesday and Thursday. And now, it seems as if the Nasdaq 100 price may rise further as trading begins for the new week.
Awọn ipele idiyele pataki:
Awọn ipele oke: $11,619, $11,669, $11,700
Awọn ipele Ilẹ: $ 11,600, $ 11,560, $ 11,520
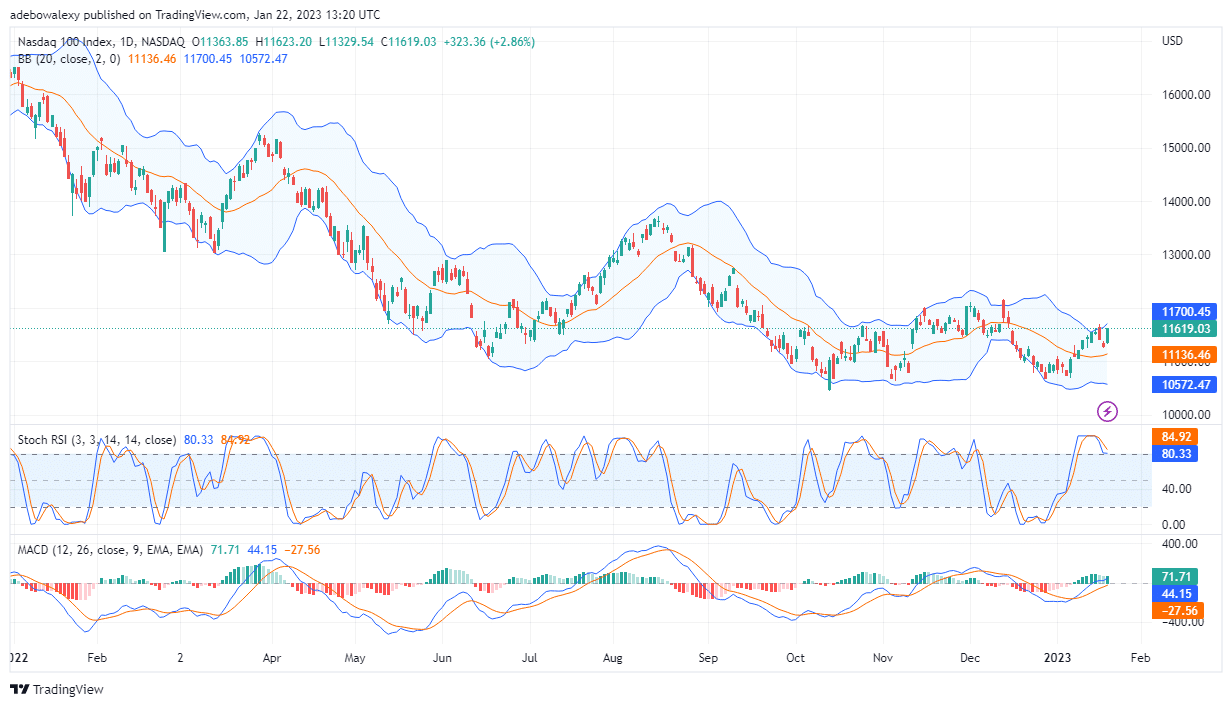
Nasdaq 100 Set to Resume Its Upward Path
In just one day, Nasdaq 100 price action on the daily market recovered over 95% of the losses that were recorded on Wednesday and Thursday last week. At this point, technical indicators are now showing positive signs concerning price moving further upwards. Here, the lines of the histogram continue to rise above the equilibrium point. Additionally, the histogram bars of this indicator has turned solid green from their previous pale appearance. By implication, this is pointing to an increase in upside momentum, which will cause prices to increase. Furthermore, the Stochastic RSI lines too are now approaching each other for an upward crossover. It could be seen that both the RSI and the MACD are predicting a further price increase.
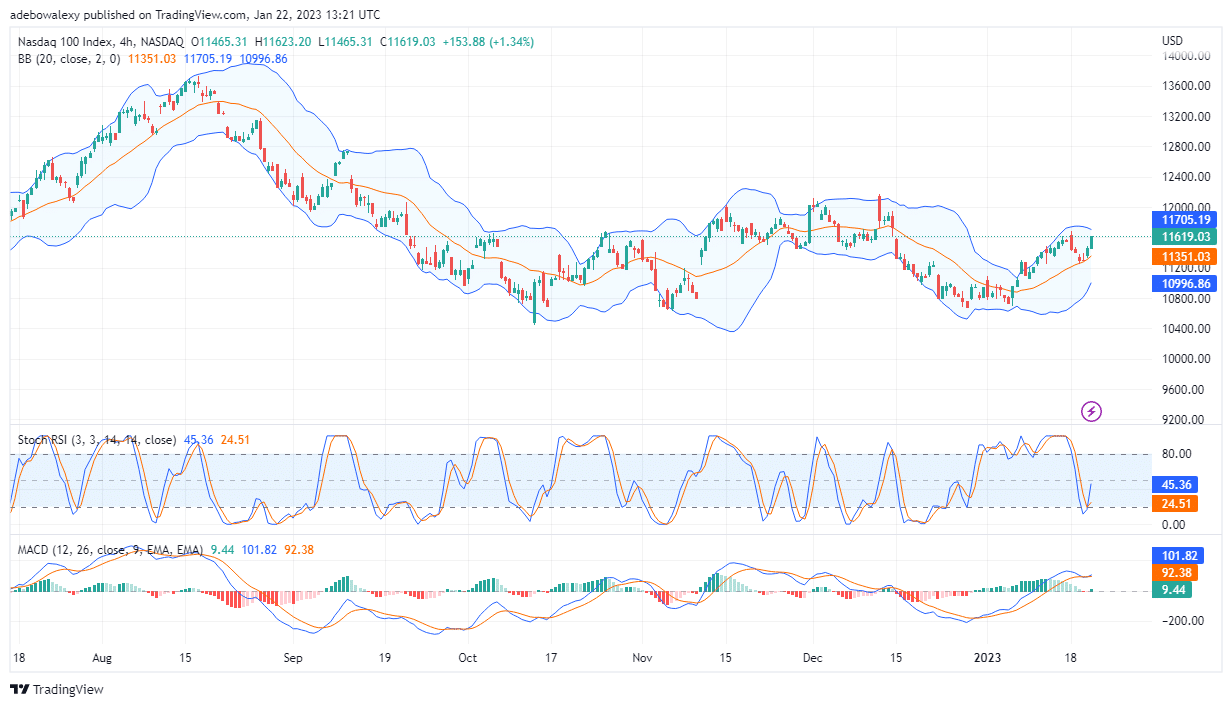
Nasdaq 100 Price Action May Break the Price Level $11,700 to the Upside
On the 4-hour market, price action maintains its focus on the upside. During the last two trading sessions of last week, the Nasdaq 100 market recorded two consecutive moderate gains. This could be observed, as two green price candles took off from the middle limit of the applied Bollinger band. Furthermore, the RSI indicator has already given a crossover in the oversold region. Also, the MACD indicator has given another crossover, which indicates that it will continue to move upwards above the equilibrium point. Both the RSI and MACD are still revealing that this market is aligned to catch any tailwind once trading actions start. Eventually, this may cause the Nasdaq 100 price to rise beyond the $11,700 mark.
Ṣe o fẹ lati mu iṣowo rẹ lọ si ipele ti atẹle? Darapọ mọ pẹpẹ ti o dara julọ fun iyẹn nibi.
- alagbata
- Idogo min
- O wole
- Ṣabẹwo si Broker

- Syeed iṣowo Cryptocurrency ti o gba ẹbun
- $ 100 idogo to kere ju,
- FCA & Cysec ṣe ilana

- 20% kaabo ajeseku ti to $ 10,000
- Idogo ti o kere ju $ 100
- Daju iroyin rẹ ṣaaju ki o to ka ajeseku

- Lori awọn ọja inawo oriṣiriṣi 100
- Ṣe idoko-owo lati diẹ bi $ 10
- Yiyọ ọjọ kanna ṣee ṣe
- Iṣiro Awọn ọja Iṣowo Moneta pẹlu o kere ju $ 250
- Jade ni lilo fọọmu lati beere fun idogo idogo 50% rẹ