
Iṣẹ fun daakọ iṣowo. Algo wa yoo ṣii laifọwọyi ati tilekun awọn iṣowo.
L2T Algo n pese awọn ifihan agbara ere pupọ pẹlu eewu kekere.
24/7 iṣowo cryptocurrency. Nigba ti o sun, a isowo.
Iṣeto iṣẹju 10 pẹlu awọn anfani nla. Iwe itọnisọna ti pese pẹlu rira.
Oṣuwọn aṣeyọri 79%. Awọn abajade wa yoo dun ọ.
Titi di awọn iṣowo 70 fun oṣu kan. Nibẹ ni o wa siwaju sii ju 5 orisii wa.
Ṣiṣe alabapin oṣooṣu bẹrẹ ni £ 58.
• The latest weakness in the price could foot a short-term bearish setup for Bitcoin.
• Bitcoin turns weak after smashing 7-month high around $9600.
Over the past five days now, Bitcoin’s volatility has been subdued with choppy price actions and at the same time keeps the world largest cryptocurrency in a consolidation mode. Today, Bitcoin has slightly dropped from a 7-month high of $9625 to where it’s currently trading at. If the price manages to close below $9200, BTC would be doomed for a strong bearish correction.
Awọn ipele resistance bọtini: $ 9625, $ 10000
Awọn ipele atilẹyin bọtini: $ 9000, $ 8600
Bitcoin (BTC) Onínọmbà Iye: Iwe apẹrẹ ojoojumọ - Bearish
Bitcoin has been struggling with the red resistance zone for a while now. Apart from suppressing bullish actions for days, this $9200-$9600 range has become a controversial area amongst traders since late January. This scenario has subjected Bitcoin to a squeeze. Most times, such squeeze often lead to a big move in the market, be it continuation or reversal.
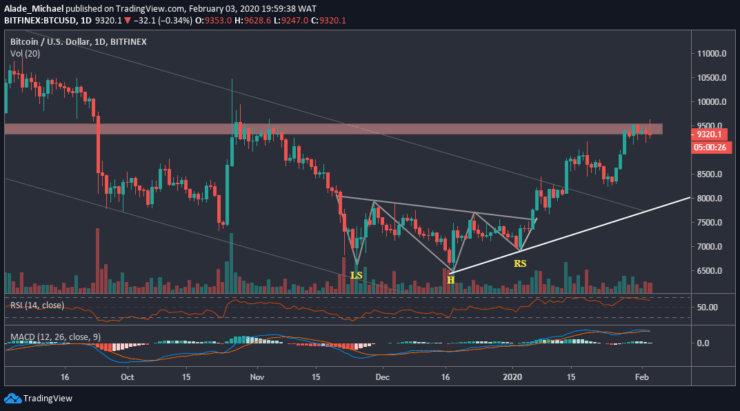
However, a continuation would occur if Bitcoin breaks well above the red zone of $9625 resistance before looking next for $10000. In case of a reversal, Bitcoin could breach $9200 to $9000 and $8600 support. A steep drop could further roll BTC into $8400 on the rising trend line with a potential bounce. The technical indicators suggest that Bitcoin is getting weak on the daily chart. A fall could be underway.
Bitcoin (BTC) Onínọmbà Iye: 4H Chart - Bearish
Bitcoin is slowly heading downward on the 4-hours chart. As we can see, the price was recently rejected from the channel’s resistance for the past few days now. The bearish play would become significant if Bitcoin slump to the channel’s support that is forming since January 11. However, the closest support is $9000 and $8800. If Bitcoin dips beneath this channel, it could result in a massive loss in price.
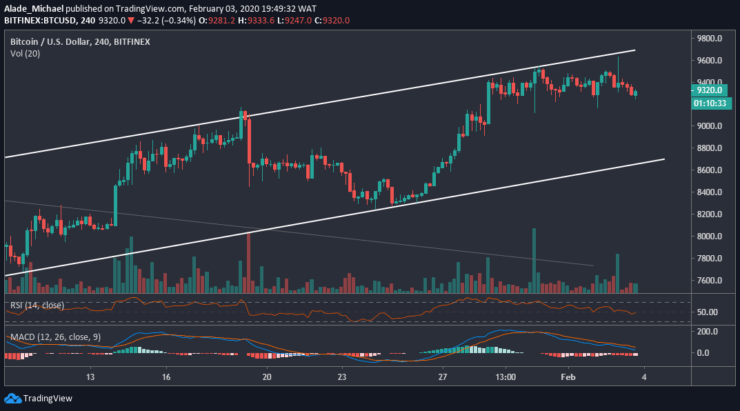
At the moment, the volume is dropping on the 4-hours chart. So we can expect a decline. Should Bitcoin keep supported by the $9200, the market could remain on a sideways or break up to the next resistance level of $9600 and $9800. After dropping, Bitcoin has now reached the mid-level on the technical RSI and MACD indicators. A cross below this level could trigger more sell for Bitcoin. As of now, Bitcoin is footing a bearish pattern.
BITCOIN TA TỌ
Ta: $ 9300
TP: $ 9134
SL: $ 9704
- alagbata
- Idogo min
- O wole
- Ṣabẹwo si Broker

- Syeed iṣowo Cryptocurrency ti o gba ẹbun
- $ 100 idogo to kere ju,
- FCA & Cysec ṣe ilana

- 20% kaabo ajeseku ti to $ 10,000
- Idogo ti o kere ju $ 100
- Daju iroyin rẹ ṣaaju ki o to ka ajeseku

- Lori awọn ọja inawo oriṣiriṣi 100
- Ṣe idoko-owo lati diẹ bi $ 10
- Yiyọ ọjọ kanna ṣee ṣe
- Iṣiro Awọn ọja Iṣowo Moneta pẹlu o kere ju $ 250
- Jade ni lilo fọọmu lati beere fun idogo idogo 50% rẹ