
Service for copy trading. Our Algo automatically opens and closes trades.
The L2T Algo provides highly profitable signals with minimal risk.
24/7 cryptocurrency trading. While you sleep, we trade.
10 minute setup with substantial advantages. The manual is provided with the purchase.
79% Success rate. Our outcomes will excite you.
Up to 70 trades per month. There are more than 5 pairs available.
Monthly subscriptions begin at £58.
Key Support Levels: $0.25, $0.20, $0.15
XRP/USD Long-term Trend: Bullish
For the past 5 days, XRP is making a slow but steady upward move. On the first day, the price rose from $0.20 to $0.22 but the coin pulled back to $0.21. Today, the price has jumped above the $0.23 price level but pulled back to the low of $0.23. XRP is now facing some resistance near the price of $0.23500. This resistance is the previous support in September. A break above $0.23500, will see the coin rallying above $0.24 price level.
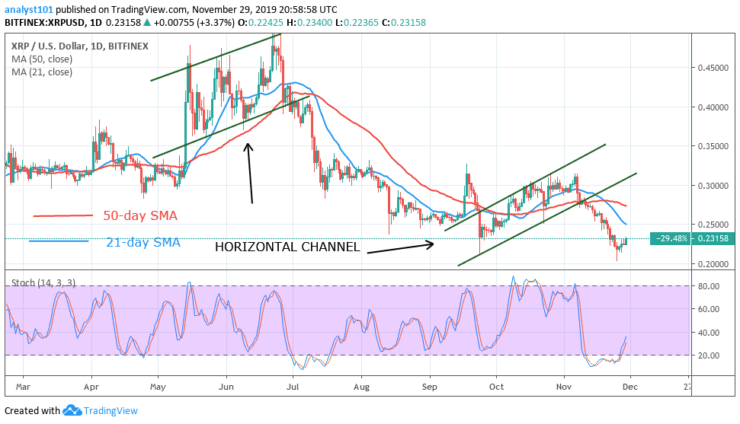
Daily Chart Indicators Reading:
The XRP market is above 20% range of the daily stochastic indicator. This means that the market is in bullish momentum. The 50-day SMA and 21-day SMA are pointing southward negating the price action.
XRP/USD Medium-term Prediction: Bullish
On the 4-hour chart, the coin has moved to a bullish trend. The XRP is currently retracing after testing a resistance above $0.23
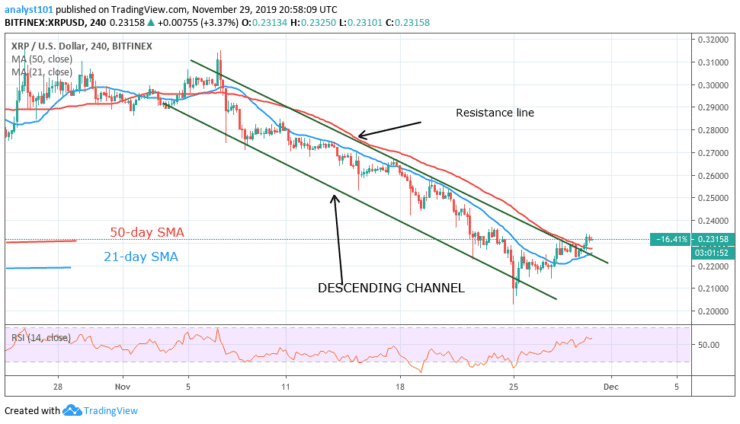
4-hour Chart Indicators Reading
The bullish candlestick breaks above the 21-day SMA and 50-day SMA; this indicates that XRP is rising. The RSI period 14 level 59 indicates that the price is above the centerline 50. XRP is rising and approaching the bullish trend zone.
General Outlook for Ripple (XRP)
XRP is rising and in a bullish trend. The upward move is likely to be sustained if the price remains above the EMAs. In other words, if the price is above the resistance line, the upward move will be sustained. However, if the price drops below these levels; the selling pressure will resume.
Ripple (XRP) Trade Signal
Instrument: XRPUSD
Order: buy Limit
Entry price: $0.22
Stop: $0.15
Target: $0.30
- Broker
- Min Deposit
- Score
- Visit Broker

- Award-winning Cryptocurrency trading platform
- $100 minimum deposit,
- FCA & Cysec regulated

- 20% welcome bonus of upto $10,000
- Minimum deposit $100
- Verify your account before the bonus is credited

- Over 100 different financial products
- Invest from as little as $10
- Same-day withdrawal is possible
- Fund Moneta Markets account with a minimum of $250
- Opt in using the form to claim your 50% deposit bonus