
Inkonzo yokurhweba ikopi. I-Algo yethu ivula ngokuzenzekelayo kwaye ivale urhwebo.
I-L2T Algo inikezela ngemiqondiso enengeniso ephezulu kunye nomngcipheko omncinci.
24/7 urhwebo cryptocurrency. Ngelixa ulalayo, siyarhweba.
Ukuseta imizuzu eli-10 kunye neenzuzo ezinkulu. Incwadi yesikhokelo ibonelelwe ngokuthenga.
79% izinga lempumelelo. Iziphumo zethu ziya kukuvuyisa.
Ukuya kuthi ga kwi-70 yorhwebo ngenyanga. Kukho ngaphezu kwe-5 izibini ezikhoyo.
Imirhumo yenyanga iqala kwi-£58.
Uhlalutyo lwamaxabiso e-STELLAR-Epreli 14
After the pulling back, should the bulls push up the price above the resistance level of $0.69, resistance level of $0.76 may be tested and the price may further increase towards $0.85. In case the bears defend the $0.69 level, there may be a breakdown of the support level of $0.57, Stellar will decrease to $0.50 and $0.22 levels.
Intengiso yeXLM / USD
Amanqanaba aphambili:
Amanqanaba okumelana: $ 0.69, $ 0.76, $ 0.85
Amanqanaba enkxaso: $ 0.57, $ 0.50, $ 0.42
I-XLM / USD yexesha elide iTrend: Bullish
On the daily chart, Stellar is bullish. After the breakout of XLMUSD from the ranging zone, the coin has been increasing. In other words, the bulls has been dominating the market. The former resistance level of $0.57 was broken up on April 11. The price increases to test the resistance level at $0.69. The price is pulling back towards the $0.57 level.
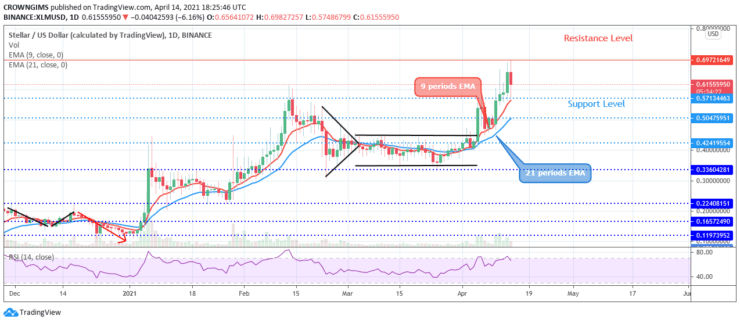
Stellar price maintains its position above the two EMAs and continues its trading above the 9 periods EMA and 21 periods EMA with the two separate from each other which indicate that bullish momentum is increasing in the Stellar market. After the pulling back, should the bulls push up the price above the resistance level of $0.69, resistance level of $0.76 may be tested and the price may further increase towards $0.85. In case the bears defend the $0.69 level, there may be a breakdown of the support level of $0.57, Stellar will decrease to $0.50 and $0.22 levels. The relative strength index period 14 is exhibiting sell signal at 50 levels with the signal line bending down.
I-XLM / USD yeXesha eliPhakathi leTrend: Bullish
XLM is on the bullish in the 4-hour chart. There is a further increase in the bulls’ pressure and the resistance level at $0.57 could not resist the pressure. It is penetrated and increases to $0.69 price level. It pulls back and retest the $0.57 level at the moment of writing this report.
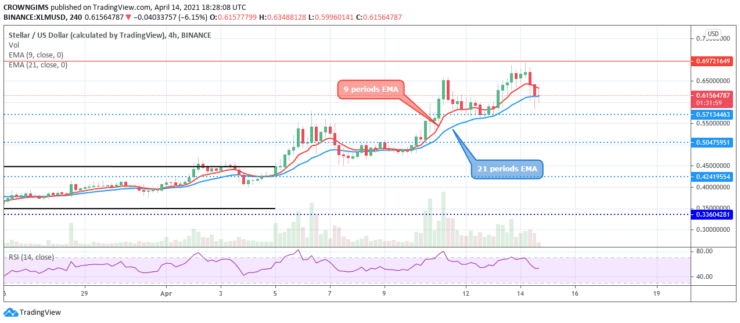
The price is penetrating the 9 periods EMA and 21 periods EMA downside with the two EMAs separate from each other to indicate bearish momentum. The Relative Strength Index period 14 is at 50 levels and the signal line is exhibiting sell signal.
- umrhwebi
- Idiphozithi encinci
- Inqaku
- Ndwendwela iBroker

- Iqonga lokurhweba nge-Cryptocurrency yokuwonga amabhaso
- $ 100 idiphozithi encinci,
- I-FCA kunye neCysec zilawulwa

- I-20% yamkelekile ibhonasi ye- $ 10,000
- Ubuncinci bediphozithi $ 100
- Qinisekisa iakhawunti yakho ngaphambi kokuba kufakwe ibhonasi

- Ngaphezulu kwe-100 yemveliso eyahlukeneyo yezemali
- Gcina imali encinci njenge- $ 10
- Ukurhoxiswa kwemini enye kunokwenzeka
- Amaxabiso aphantsi okuThengisa
- 50% Ibhonasi yeMkeleki
- Ukuphumelela amabhaso Inkxaso yeyure ezingama-24
- I-akhawunti yeMakethi yeMoneta yeNgxowa-mali enobuncinci be- $ 250
- Khetha ukusebenzisa le fomu ukubanga i-50% yebhonasi yakho yediphozithi