S&P 500 Price Analysis – May 17
S&P 500 breaks down the previous low at $4020 support level, and further decrease in price may reach $3927, $3832 and $3740 support levels. In case the support level of $3927 is defended by the bulls, price may face resistance levels at $4020, $4087 and $4137 levels.
Key levels:
Resistance levels: $4020, $4087, $4137
Support levels: $3927, $3832, $3740
S&P 500 Long-term trend: Bearish
S&P 500 is bearish on the daily chart. There was no significant movement in the S&P 500 market last week. After the Sellers’ interruption, the bullish pressure was seized at $4276 with the formation of candle pattern called inside bar. The bulls could not propel the price above the resistance level of $4276. The price of S&P 500 declines and penetrated the former support levels of $4020 downside. Bearish momentum increases and the support level of $3927 was tested.
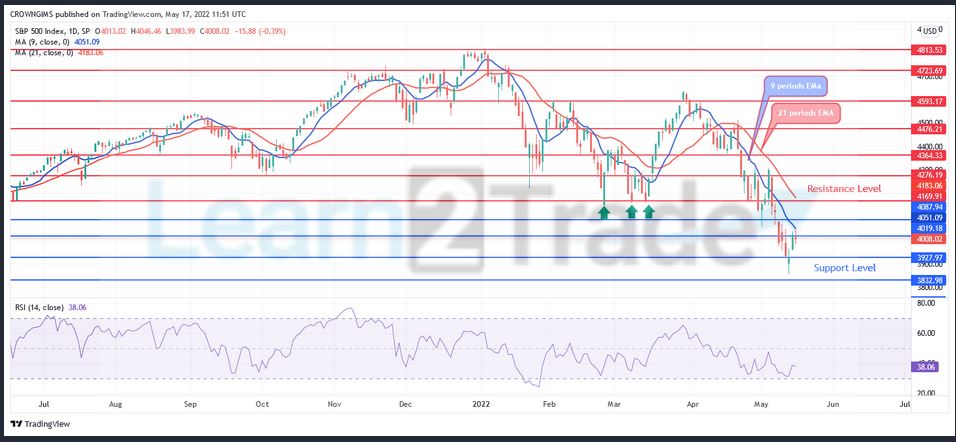
S&P 500 is trading below the 9 periods EMA and the 21 periods EMA at close contact which connote a decrease in the bears’ pressure. The relative strength index period 14 is at 38 levels with the signal lines pointing up to indicate buy signal. S&P 500 tested the previous low at $3927 support level, and further decrease in price may reach $3832 and $3740 support levels. In case the support level of $3927 is defended by the bulls, price may face resistance levels at $4020, $4087 and $4137 levels.
S&P 500 Medium-term Trend: Bearish
S&P 500 is on the bearish trend on the 4-hour chart outlook. It seems the bears’ pressure is failing gradually as the price breaks up the dynamic resistance level of 9 EMA. Price is risen as the bears’ pressure decreases. The price bounced up when it tested the support level of $832. Bullish movement may commence.
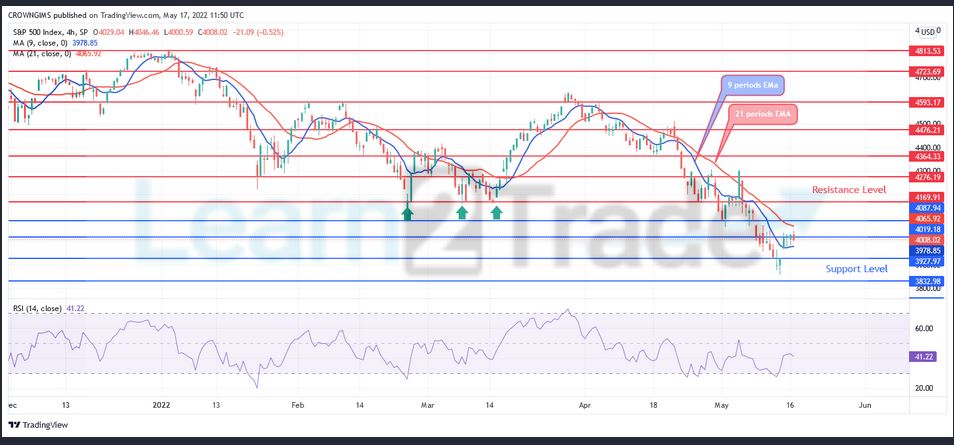
The price is trading between the 9 periods EMA and 21 periods EMA as an indication of bullish movement. The relative strength index period 14 is at 41 levels displaying bullish signal.
You can purchase Lucky Block here. Buy LBlock:
- Broker
- Min Deposit
- Score
- Visit Broker

- Award-winning Cryptocurrency trading platform
- $100 minimum deposit,
- FCA & Cysec regulated

- 20% welcome bonus of upto $10,000
- Minimum deposit $100
- Verify your account before the bonus is credited
- Fund Moneta Markets account with a minimum of $250
- Opt in using the form to claim your 50% deposit bonus
Learn to Trade
Never Miss A Trade Again

Signal Notification
Real-time signal notifications whenever a signal is opened, closes or Updated

Get Alerts
Immediate alerts to your email and mobile phone.

Entry Price Levels
Entry price level for every signal Just choose one of our Top Brokers in the list above to get all this free.