
Inkonzo yokurhweba ikopi. I-Algo yethu ivula ngokuzenzekelayo kwaye ivale urhwebo.
I-L2T Algo inikezela ngemiqondiso enengeniso ephezulu kunye nomngcipheko omncinci.
24/7 urhwebo cryptocurrency. Ngelixa ulalayo, siyarhweba.
Ukuseta imizuzu eli-10 kunye neenzuzo ezinkulu. Incwadi yesikhokelo ibonelelwe ngokuthenga.
79% izinga lempumelelo. Iziphumo zethu ziya kukuvuyisa.
Ukuya kuthi ga kwi-70 yorhwebo ngenyanga. Kukho ngaphezu kwe-5 izibini ezikhoyo.
Imirhumo yenyanga iqala kwi-£58.
I-Polygon (MATICUSD) Uhlalutyo lwexabiso - Agasti 08
In case the resistance level of $1.01 is broken upside, the resistance level at $1.18 price level may be reached and penetrated to test the $1.31. Should the bears oppose bulls at the resistance level of $1.01, the price may reverse and continue a bearish trend to $0.91, $0.74 and $0.55 levels.
Amanqanaba aphambili:
Amanqanaba okumelana: $ 1.01, $ 1.18, $ 1.31
Amanqanaba enkxaso: $ 0.91, $ 0.74, $ 0.55
MATIC/USD Ixesha elide Trend: Bullish
MATIC/USD price is on the bullish trend on the Long-term outlook. Our bullish target on the daily chart when the bullish chart pattern formed was reached at $1.01 on July 31. The bears defended the just mentioned level and pulled back to retest the support level of $0.91. Price consolidates around the just mentioned level for few days. At the moment, the bulls are gaining more momentum price is increasing towards the previous high at $1.01 level.
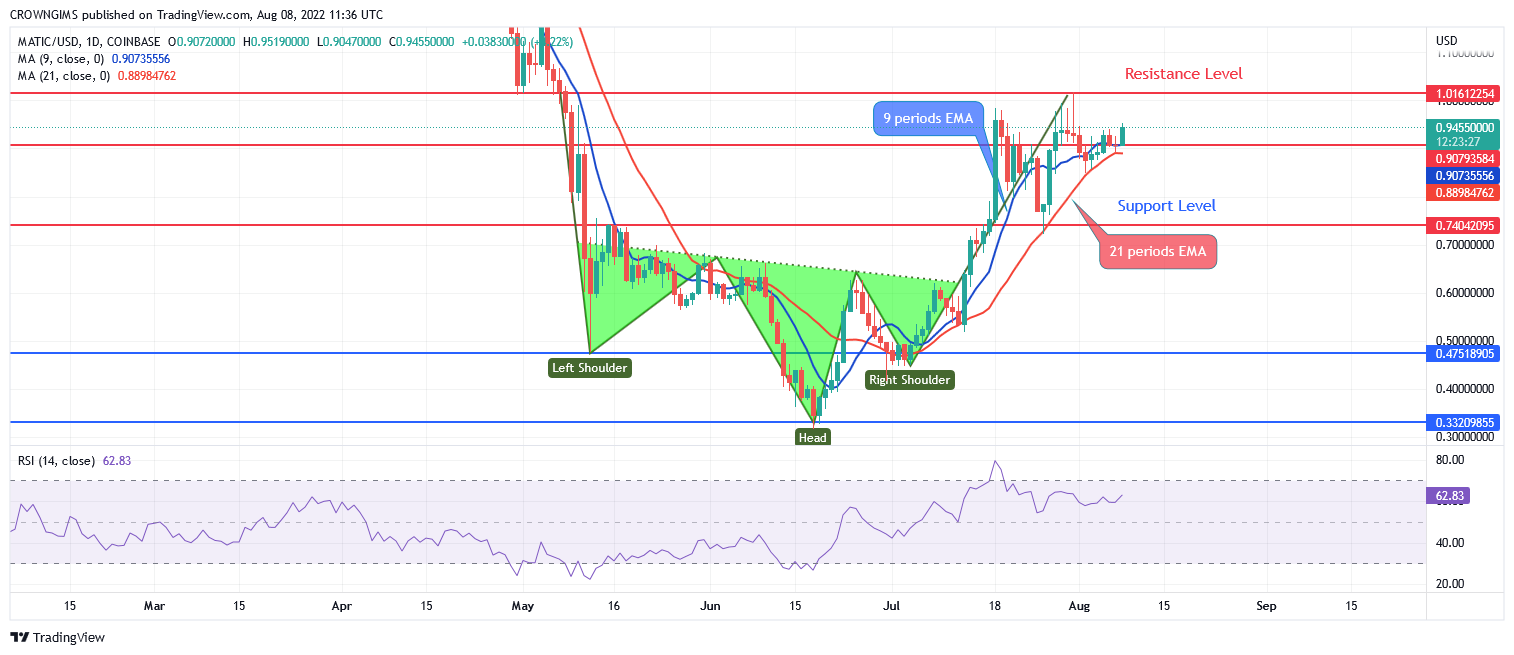
Polygon is trading above the 9 periods EMA and 21 periods EMA. Further increase in the Polygon price is highly envisaged. In case the resistance level of $1.01 is broken upside, the resistance level at $1.18 price level may be reached and penetrated to test the $1.31. Should the bears oppose bulls at the resistance level of $1.01, the price may reverse and continue a bearish trend to $0.91, $0.74 and $0.55 levels.
MATIC/USD Ixesha elifutshane iTrendi: Bullish
Polygon is bullish on the medium-term outlook. The price pulled back after tested the resistance level of $1.01 on July 28. The support level of $0.74 was retested on July 26. The bullish engulfing candle pattern formed restored the bullish movement towards the resistance level of $1.01 level. Bullish trend may continue as more bullish candles are produced.
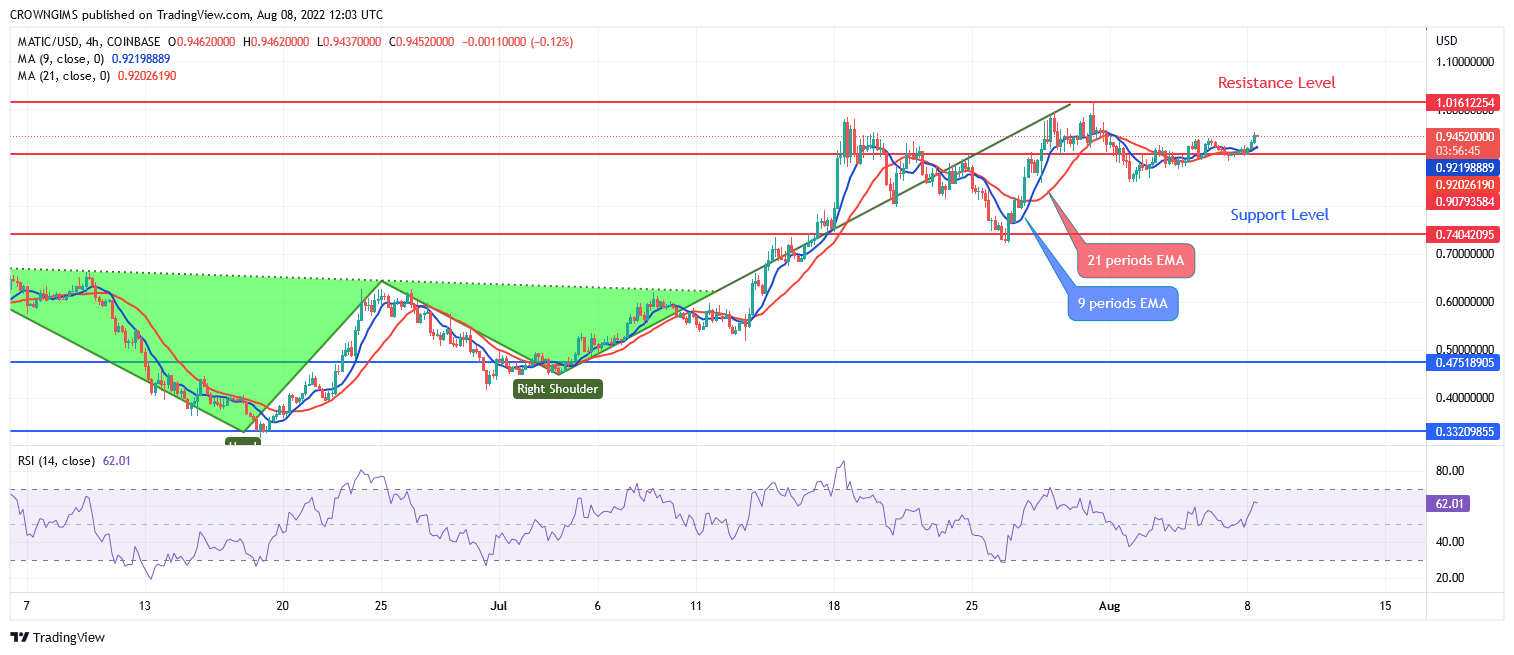
The 9-day EMA is above the 21 periods EMA and the Polygon price is trading above the two EMAs at distance which indicates a bullish movement. However, the relative strength index period 14 is at 63 levels with the signal line pointing up to connote buy signal.
- umrhwebi
- Idiphozithi encinci
- Inqaku
- Ndwendwela iBroker

- Iqonga lokurhweba nge-Cryptocurrency yokuwonga amabhaso
- $ 100 idiphozithi encinci,
- I-FCA kunye neCysec zilawulwa

- I-20% yamkelekile ibhonasi ye- $ 10,000
- Ubuncinci bediphozithi $ 100
- Qinisekisa iakhawunti yakho ngaphambi kokuba kufakwe ibhonasi

- Ngaphezulu kwe-100 yemveliso eyahlukeneyo yezemali
- Gcina imali encinci njenge- $ 10
- Ukurhoxiswa kwemini enye kunokwenzeka
- Amaxabiso aphantsi okuThengisa
- 50% Ibhonasi yeMkeleki
- Ukuphumelela amabhaso Inkxaso yeyure ezingama-24
- I-akhawunti yeMakethi yeMoneta yeNgxowa-mali enobuncinci be- $ 250
- Khetha ukusebenzisa le fomu ukubanga i-50% yebhonasi yakho yediphozithi