
Inkonzo yokurhweba ikopi. I-Algo yethu ivula ngokuzenzekelayo kwaye ivale urhwebo.
I-L2T Algo inikezela ngemiqondiso enengeniso ephezulu kunye nomngcipheko omncinci.
24/7 urhwebo cryptocurrency. Ngelixa ulalayo, siyarhweba.
Ukuseta imizuzu eli-10 kunye neenzuzo ezinkulu. Incwadi yesikhokelo ibonelelwe ngokuthenga.
79% izinga lempumelelo. Iziphumo zethu ziya kukuvuyisa.
Ukuya kuthi ga kwi-70 yorhwebo ngenyanga. Kukho ngaphezu kwe-5 izibini ezikhoyo.
Imirhumo yenyanga iqala kwi-£58.
Uhlalutyo lwamaxabiso eBitcoin SV-Agasti 20
An increase in the bears’ pressure to penetrate the $198 price level downside will expose the coin to $179, which may extend to $153 demand level. In case the demand level of $198 holds, the coin will be facing the resistance levels at $198, $179, and $153.
Intengiso ye-BSV / USD
Amanqanaba aphambili:
Amanqanaba okumelana: $ 217, $ 259, $ 311
Amanqanaba enkxaso: $ 198, $ 179, $ 153
I-BSV / i-USD yexesha elide iTrendar: Qalisa
Bitcoin SV was under the control of the bulls three days ago. The bullish momentum failed when the bears interrupted the move with the formation of a bearish engulfing candle before it reaches the mark at $259. Following the scenario was another big daily bearish candle that breaks the barrier at $217 downside. The coin is aiming at $179 price level. In other words on the long-term outlook, Bitcoin SV is bearish.
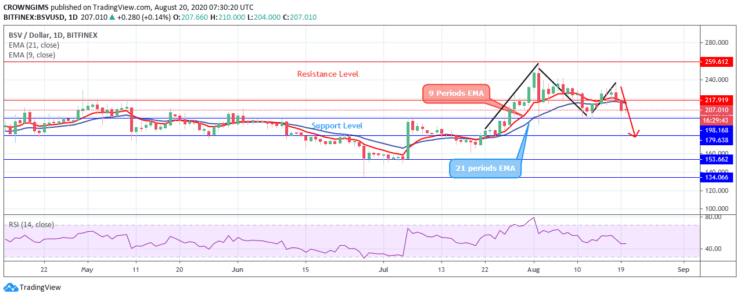
An increase in the bears’ pressure to penetrate the $198 price level downside will expose the coin to $179, which may extend to $153 demand level. In case the demand level of $198 holds, the coin will be facing the resistance levels at $198, $179, and $153. The price has already crossed the two EMAs downside, that is, trading is ongoing below the 9 periods EMA and 21 periods EMA. Further decrease in price is envisaged as the daily bearish candle opens the market. Besides, the Relative Strength Index is bending down at 40 levels indicates the sell signal.
I-BSV / i-USD yeXesha leXesha eliPhakathi: Qalisa
Bitcoin SV price action is completing the formation of a chart pattern called short “M”. This is a bearish momentum chart pattern that means, the coin may decline further. The price is currently declining towards the demand level at $198 and it is trading below the 9 periods EMA and 21 periods EMA which connotes strong bearish momentum.
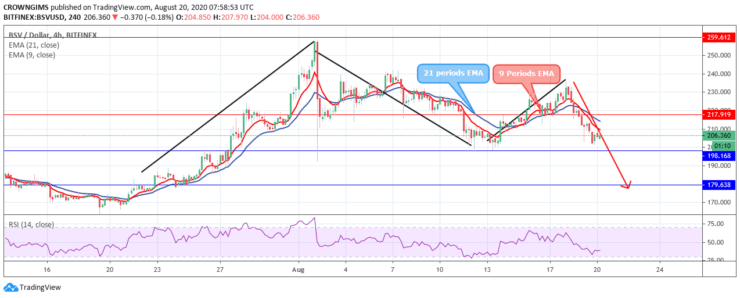
The relative strength index period 14 is found below 50 levels bending towards the south indicates a sell signal. The coin may breakdown the $198 level and targets the $179 price level.
- umrhwebi
- Idiphozithi encinci
- Inqaku
- Ndwendwela iBroker

- Iqonga lokurhweba nge-Cryptocurrency yokuwonga amabhaso
- $ 100 idiphozithi encinci,
- I-FCA kunye neCysec zilawulwa

- I-20% yamkelekile ibhonasi ye- $ 10,000
- Ubuncinci bediphozithi $ 100
- Qinisekisa iakhawunti yakho ngaphambi kokuba kufakwe ibhonasi

- Ngaphezulu kwe-100 yemveliso eyahlukeneyo yezemali
- Gcina imali encinci njenge- $ 10
- Ukurhoxiswa kwemini enye kunokwenzeka
- Amaxabiso aphantsi okuThengisa
- 50% Ibhonasi yeMkeleki
- Ukuphumelela amabhaso Inkxaso yeyure ezingama-24
- I-akhawunti yeMakethi yeMoneta yeNgxowa-mali enobuncinci be- $ 250
- Khetha ukusebenzisa le fomu ukubanga i-50% yebhonasi yakho yediphozithi