
Inkonzo yokurhweba ikopi. I-Algo yethu ivula ngokuzenzekelayo kwaye ivale urhwebo.
I-L2T Algo inikezela ngemiqondiso enengeniso ephezulu kunye nomngcipheko omncinci.
24/7 urhwebo cryptocurrency. Ngelixa ulalayo, siyarhweba.
Ukuseta imizuzu eli-10 kunye neenzuzo ezinkulu. Incwadi yesikhokelo ibonelelwe ngokuthenga.
79% izinga lempumelelo. Iziphumo zethu ziya kukuvuyisa.
Ukuya kuthi ga kwi-70 yorhwebo ngenyanga. Kukho ngaphezu kwe-5 izibini ezikhoyo.
Imirhumo yenyanga iqala kwi-£58.
Uhlalutyo lwamaxabiso e-ADA-Okthobha 20
Should the price test the resistance level at $0.11 and the daily candle close above it, then, $0.13 and $0.14 resistance levels may be tested. The inability to break up the $0.11 level by the bulls may trigger the bears to take over the ADA market.
Intengiso yeADA / USD
Amanqanaba aphambili:
Amanqanaba okumelana: $ 0.11, $ 0.13, $ 0.14
Amanqanaba enkxaso: $ 0.10, $ 0.08, $ 0.07
I-ADA / i-USD yexesha elide iTrend: Bullish
The bulls are maintaining their bullish position in the ADA market. There are low volatility and low bullish momentum and that is why there was no significant difference in the last week’s market. ADA price observed a price retracement towards the dynamic support levels, the level prevents further price reduction. The price is slowly increasing towards the resistance level of $0.11.
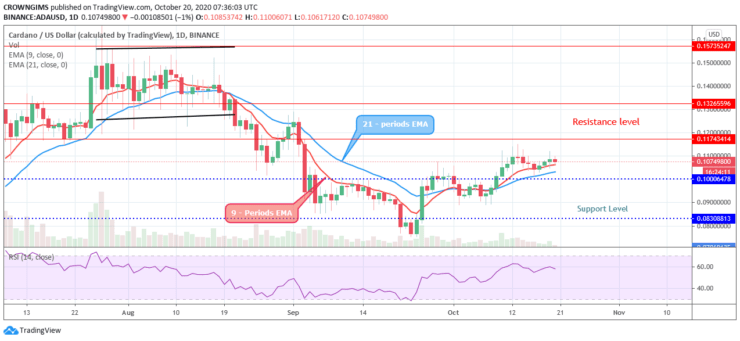
Cardano price continues trading above the 9 periods EMA and 21 periods EMA as a symbol of the bullish movement. The bulls may dominate the ADA market further as the moving averages are steep at an angle of 45 degrees with the formation of bullish candles. Should the price test the resistance level at $0.11 and the daily candle close above it, then, $0.13 and $0.14 resistance levels may be tested. The inability to break up the $0.11 level by the bulls may trigger the bears to take over the ADA market. Meanwhile, the relative strength index period 14 is at 60 levels and the signal line pointing down to indicate sell signal.
I-ADA / i-USD yeXesha eliPhakathi lokuHamba: Bullish
ADA/USD is bullish on the 4-hour chart. After the breakup of the $0.10 resistance level, the price steadily increases towards the $0.11 resistance level. The price pulls back to the dynamic support level and it is consolidating around the dynamic levels.
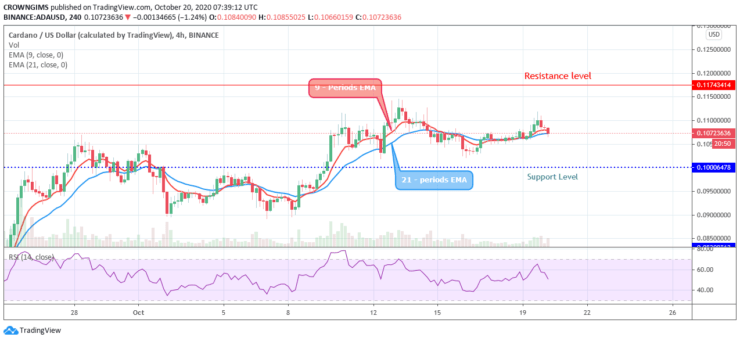
The Relative Strength Index period 14 with its signal line at 50 levels bending down to indicate sell signal. The price may increase further after the pullback.
- umrhwebi
- Idiphozithi encinci
- Inqaku
- Ndwendwela iBroker

- Iqonga lokurhweba nge-Cryptocurrency yokuwonga amabhaso
- $ 100 idiphozithi encinci,
- I-FCA kunye neCysec zilawulwa

- I-20% yamkelekile ibhonasi ye- $ 10,000
- Ubuncinci bediphozithi $ 100
- Qinisekisa iakhawunti yakho ngaphambi kokuba kufakwe ibhonasi

- Ngaphezulu kwe-100 yemveliso eyahlukeneyo yezemali
- Gcina imali encinci njenge- $ 10
- Ukurhoxiswa kwemini enye kunokwenzeka
- Amaxabiso aphantsi okuThengisa
- 50% Ibhonasi yeMkeleki
- Ukuphumelela amabhaso Inkxaso yeyure ezingama-24
- I-akhawunti yeMakethi yeMoneta yeNgxowa-mali enobuncinci be- $ 250
- Khetha ukusebenzisa le fomu ukubanga i-50% yebhonasi yakho yediphozithi