Bulls may continue dominating S&P 500 market
S&P 500 Price Analysis – 14 February
Should purchasing pressure picks up, the S&P 500 may break through the $4169 resistance level, and more buying pressure could drive the price up to the $4276 and $4286 levels. The price may revert and fall in the direction of the support levels of $4087, $3929, and $3740 if the $4169 resistance level is retained.
Key levels:
Resistance levels: $4169, $4276, $4286
Support levels: $4087, $3929, $3740
S&P 500 Long-term trend: Bullish
On the daily chart, the S&P 500 is moving in a bullish direction. On December 13, buyers forced the price up to the cap of $4087. The predicted degree of resistance really served as a hindrance to the rising trend. A double top chart pattern that deterred purchasers was seen at the level. The $3740 barrier was crossed with the help of sellers’ pressure, but the price was unable to drop below it. On January 27, the peak from December underwent another test, and on 01 February, it was breached upward and $4169 level was tested. At the moment, the price is ranging between $4169 and $4087 levels.
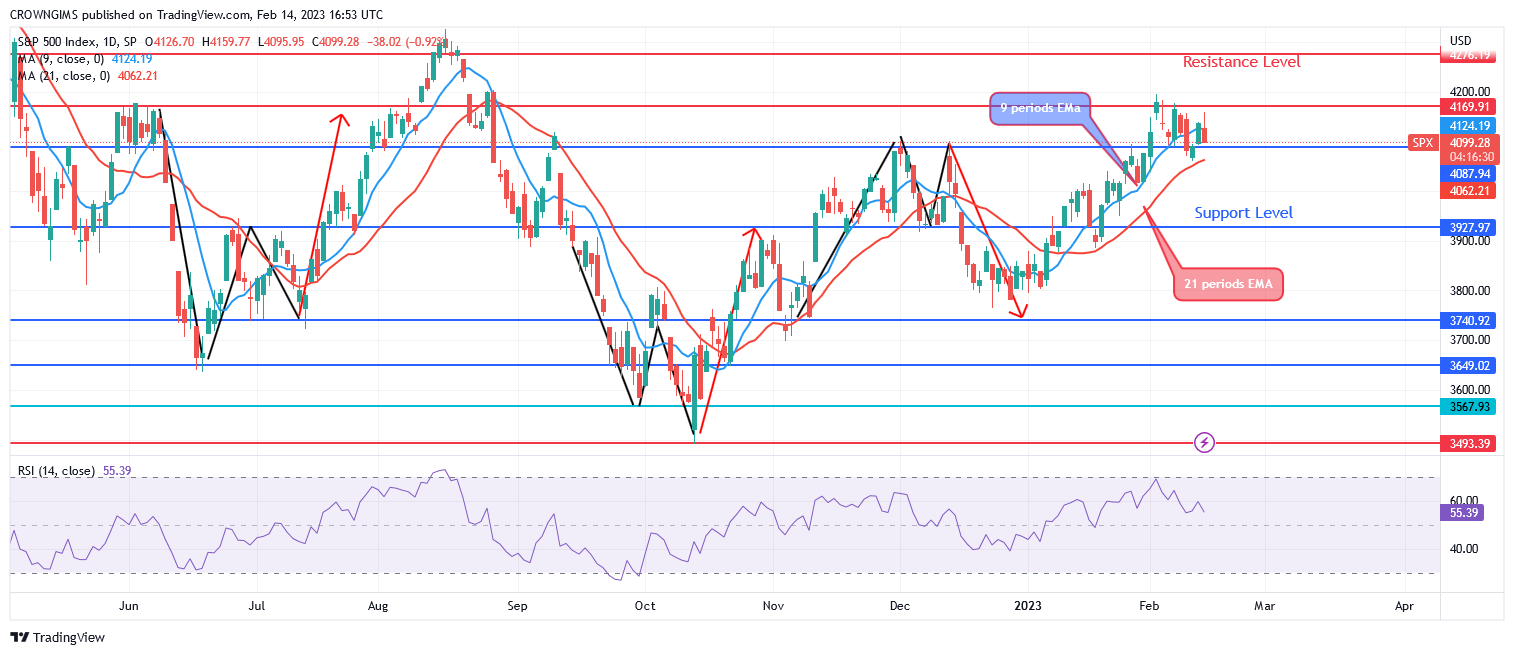
The 9-period and 21-period exponential moving averages of the S&P 500 are now being traded above. Should purchasing pressure picks up, the S&P 500 may break through the $4169 resistance level, and more buying pressure could drive the price up to the $4276 and $4286 levels. The price may revert and fall in the direction of the support levels of $4087, $3929, and $3740 if the $4169 resistance level is retained. The relative strength index period 14 is at 56 and the signal line heading downward represents a sell signal.
S&P 500 Medium-term Trend: Bullish
On the 4-hour chart, the S&P 500 is in the positive. The S&P 500 is expected to rise, according to the projection on the 4-hour chart. The sellers’ power diminished as the price approached the $4169 resistance level. It resumed trading bullishly after four hours. The price may start to rise as the bulls gain momentum.
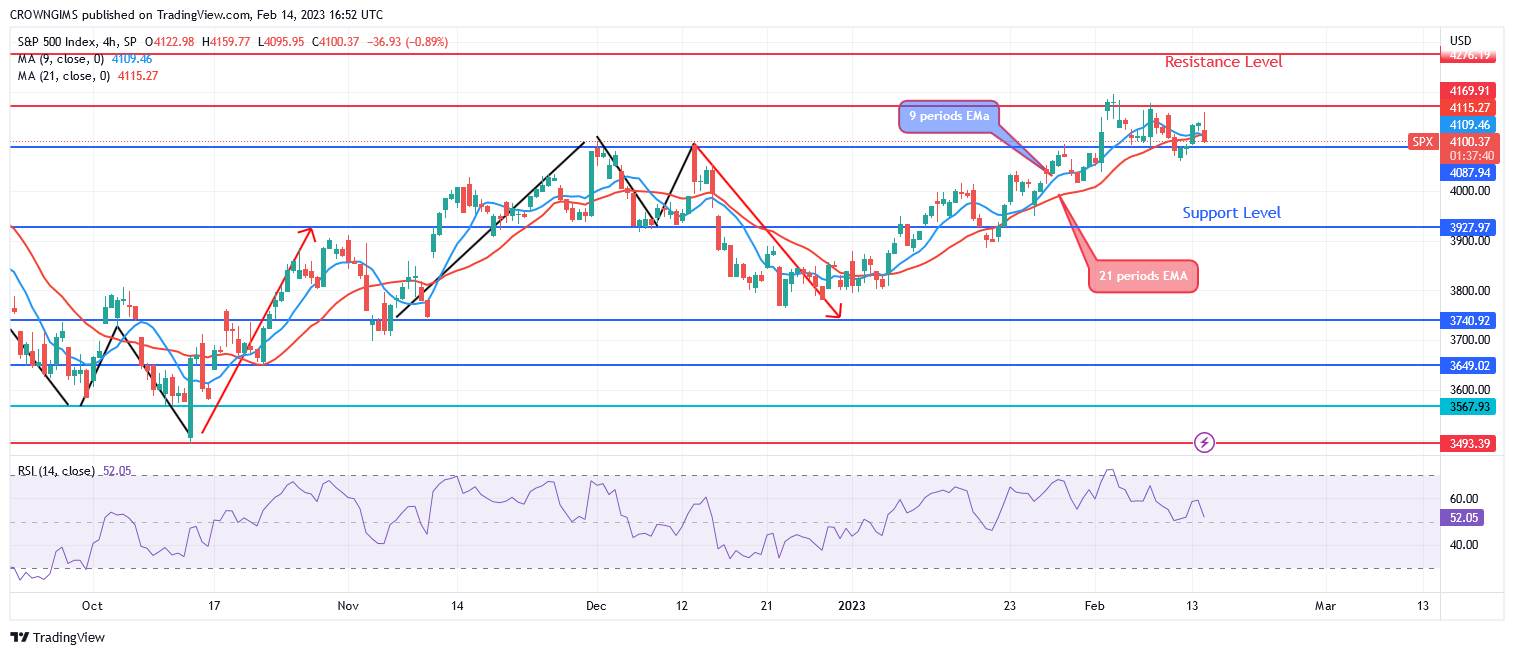
The resistance level of $4169 holds. The current price is between $4169 and $4087. The S&P 500 price is fluctuating around the 9- and 21-period exponential moving averages. The Relative Strength Index period 14 at level 54 displays a bearish signal.
You can purchase Lucky Block here. Buy LBLOCK
- Broker
- Min Deposit
- Score
- Visit Broker

- Award-winning Cryptocurrency trading platform
- $100 minimum deposit,
- FCA & Cysec regulated

- 20% welcome bonus of upto $10,000
- Minimum deposit $100
- Verify your account before the bonus is credited
- Fund Moneta Markets account with a minimum of $250
- Opt in using the form to claim your 50% deposit bonus
Learn to Trade
Never Miss A Trade Again

Signal Notification
Real-time signal notifications whenever a signal is opened, closes or Updated

Get Alerts
Immediate alerts to your email and mobile phone.

Entry Price Levels
Entry price level for every signal Just choose one of our Top Brokers in the list above to get all this free.