
Dịch vụ sao chép giao dịch. Algo của chúng tôi tự động mở và đóng giao dịch.
Thuật toán L2T cung cấp các tín hiệu có lợi nhuận cao với rủi ro tối thiểu.
Giao dịch tiền điện tử 24/7. Trong khi bạn ngủ, chúng tôi giao dịch.
Thiết lập 10 phút với những lợi thế đáng kể. Sách hướng dẫn được cung cấp khi mua hàng.
79% Tỷ lệ thành công. kết quả của chúng tôi sẽ kích thích bạn.
Lên đến 70 giao dịch mỗi tháng. Có hơn 5 cặp có sẵn.
Đăng ký hàng tháng bắt đầu từ £ 58.
Các vùng hỗ trợ chính: $ 7, 000, $ 6, 000, $ 5,000
Xu hướng dài hạn của QTUM/USD: Tăng
Qtum is in an upward move after breaking the downtrend line. In retrospect, the pair has been in a bear market since June 29, 2019. In June, Qtum was in a bull market; the bulls have taken price to the high of $5.50 but were resisted. Unfortunately, as the buyers could not penetrate the resistance, the coin was compelled to a downward move. The first bearish impulse was at a low of $2.67. The price made a pullback to the resistance at $3.0.
After retesting the resistance, the downward move continued to a low of $1.50. The bulls defended the support at $1.50 as the pair resumed a sideways trend. Later the bulls have the upper hand as the downtrend line was broken. Interestingly, as the downtrend line was broken, the upward move resumed. The coin reached a high of $3.0 but was resisted. On the downside, if the price falls to the low of $2.50, the upward move may resume.
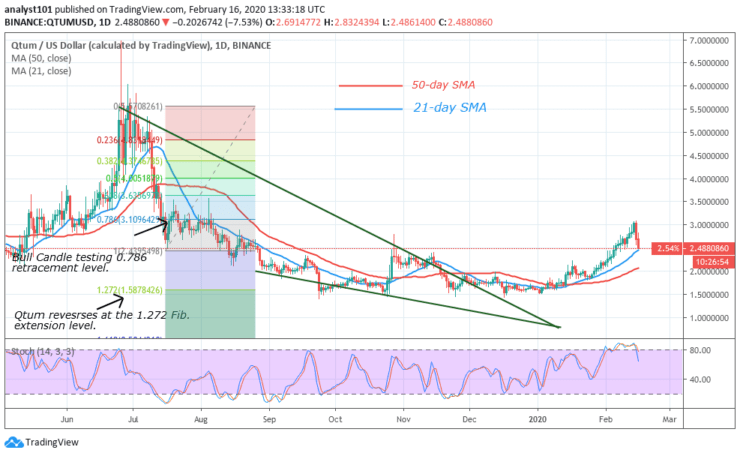
Đọc Chỉ báo Biểu đồ Hàng ngày:
Qtum is below 80% range of the daily stochastic. It means that the coin is in bearish momentum. Meanwhile, a Fibonacci tool was drawn to determine the selling pressure. A bull candle tested the 0.786 retracement level which indicates the coin is likely to reverse at the 1.272 Fibonacci extension level.
Xu hướng trung hạn của QTUM/USD: Tăng
On the 4-hour chart, Qtum is in a smooth uptrend as the market reached a high of $3.0. The bulls tested the resistance at $3 twice but were unable to penetrate it. In the process of time, a bearish double top was formed. The pattern resulted in a downward move.
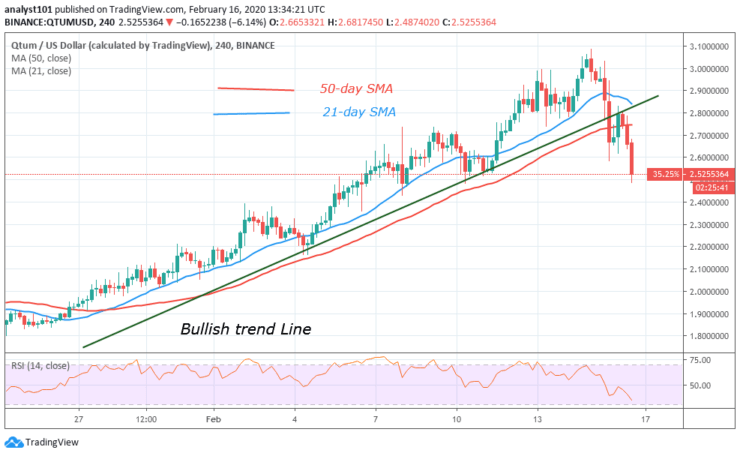
Đọc các chỉ báo biểu đồ trong 4 giờ
The Relative Strength Index period 14 level 40 indicates that the coin is in the downtrend zone. It is also below the centerline 50 which indicates that the coin is likely to fall. As the price broke below the bullish trend line, a retest was made which resulted in the downward move. It is expected that the downward move will reach a low of $2.50.
General Outlook for Bitcoin (QTUM)
Qtum is in a downward move. It is anticipated that if price retraces to the support of the 21-day SMA, an upward move will resume. Conversely, if price breaks below the SMAs, the downtrend will resume.
Tín hiệu thương mại QTUM
Công cụ: QTUM / USD
Đặt hàng: Giới hạn Mua
Giá vào cửa: $ 2.50
Dừng lại: $ 2.10
Mục tiêu: $ 3.50
Lưu ý: Learn2Trade.com không phải là cố vấn tài chính. Thực hiện nghiên cứu của bạn trước khi đầu tư tiền của bạn vào bất kỳ tài sản tài chính nào hoặc sản phẩm hoặc sự kiện được trình bày. Chúng tôi không chịu trách nhiệm về kết quả đầu tư của bạn
- Môi giới
- Min Tiền gửi
- Điểm số
- Ghé thăm môi giới

- Nền tảng giao dịch tiền điện tử từng đoạt giải thưởng
- 100 đô la tiền gửi tối thiểu,
- FCA & Cysec quy định

- 20% tiền thưởng chào mừng lên đến $ 10,000
- Ký quỹ tối thiểu $ 100
- Xác minh tài khoản của bạn trước khi tiền thưởng được ghi có

- Tài khoản Fund Moneta Markets với tối thiểu $ 250
- Chọn sử dụng biểu mẫu để nhận 50% tiền thưởng tiền gửi của bạn