
Dịch vụ sao chép giao dịch. Algo của chúng tôi tự động mở và đóng giao dịch.
Thuật toán L2T cung cấp các tín hiệu có lợi nhuận cao với rủi ro tối thiểu.
Giao dịch tiền điện tử 24/7. Trong khi bạn ngủ, chúng tôi giao dịch.
Thiết lập 10 phút với những lợi thế đáng kể. Sách hướng dẫn được cung cấp khi mua hàng.
79% Tỷ lệ thành công. kết quả của chúng tôi sẽ kích thích bạn.
Lên đến 70 giao dịch mỗi tháng. Có hơn 5 cặp có sẵn.
Đăng ký hàng tháng bắt đầu từ £ 58.
Phân tích giá NZDUSD - ngày 12 tháng XNUMX
NZDUSD will continue to fall as the price keeps making a downward movement. The price retested the 0.71620 resistance zone before bouncing back to the 0.70740 support zone. There appears to be a bullish rejection as the price continues to respond to the 0.71620 key level. Sellers have now stepped in to take the price downward. The market is expected to reach the key level of 0.70740 before breaking past it.
NZDUSD Mức đáng kể
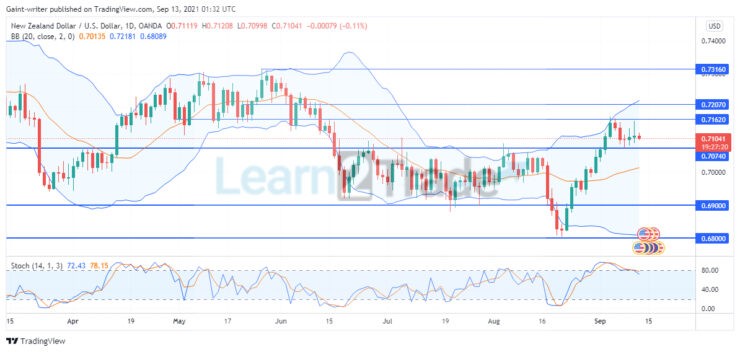
Mức kháng cự: 0.73160, 0.72070, 0.71620
Mức hỗ trợ: 0.70740, 0.69000, 0.68000
 NZDUSD Xu hướng dài hạn: Giảm giá
 NZDUSD Xu hướng dài hạn: Giảm giá
The NZDUSD market began consolidating as there appears to be price reluctance. Before the consolidation period, the price initially broke through the key level of 0.70740. However, the price reached its greatest high of 0.73160 before resuming its downward trend. As the market continues to fall precipitously, there appears to be a big pullback around the 0.72070 and 0.71620 key levels before reaching the 0.69000 support level.
However, a reversal happened at this level, and the market subsequently ranged between 0.70740 and 0.69000 important key levels before falling lower to 0.68000 significant key levels. The market subsequently had a bullish recovery, rallying back to 0.71620, but is now set to resume falling. As the Stochastic Oscillator indicator indicates a golden cross around 80.00, the price movement is likely to return to 0.70740, which will push the price into the overbought region. This indicates that the sellers are now in ascendancy.
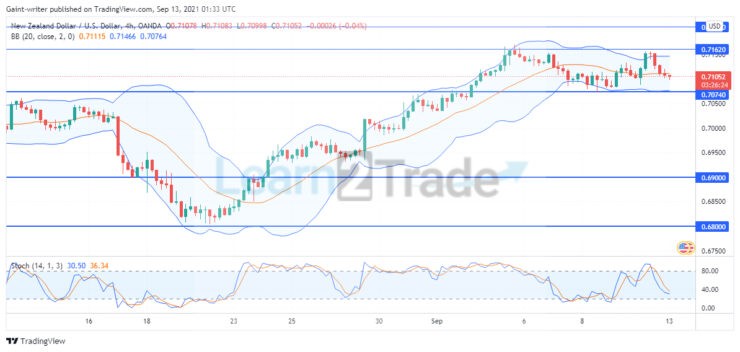
NZDUSD Xu hướng Ngắn hạn: Giảm
 NZDUSD Xu hướng Ngắn hạn: Giảm
On the 4-hour chart, the price is shown ranging after a bullish rise with higher lows and highs. The Bollinger Band depicts price movement along with the middle band when the price is expected to fall. The Stochastic Oscillator indicator also shows price falling as it approaches the 0.70740 critical level.
Bạn có thể mua tiền điện tử tại đây: Mua tiền xu
Lưu ý: learning2.trade không phải là một cố vấn tài chính. Thực hiện nghiên cứu của bạn trước khi đầu tư tiền của bạn vào bất kỳ tài sản tài chính hoặc sản phẩm hoặc sự kiện được trình bày. Chúng tôi không chịu trách nhiệm về kết quả đầu tư của bạn.
- Môi giới
- Min Tiền gửi
- Điểm số
- Ghé thăm môi giới

- Nền tảng giao dịch tiền điện tử từng đoạt giải thưởng
- 100 đô la tiền gửi tối thiểu,
- FCA & Cysec quy định

- 20% tiền thưởng chào mừng lên đến $ 10,000
- Ký quỹ tối thiểu $ 100
- Xác minh tài khoản của bạn trước khi tiền thưởng được ghi có

- Tài khoản Fund Moneta Markets với tối thiểu $ 250
- Chọn sử dụng biểu mẫu để nhận 50% tiền thưởng tiền gửi của bạn