
Dịch vụ sao chép giao dịch. Algo của chúng tôi tự động mở và đóng giao dịch.
Thuật toán L2T cung cấp các tín hiệu có lợi nhuận cao với rủi ro tối thiểu.
Giao dịch tiền điện tử 24/7. Trong khi bạn ngủ, chúng tôi giao dịch.
Thiết lập 10 phút với những lợi thế đáng kể. Sách hướng dẫn được cung cấp khi mua hàng.
79% Tỷ lệ thành công. kết quả của chúng tôi sẽ kích thích bạn.
Lên đến 70 giao dịch mỗi tháng. Có hơn 5 cặp có sẵn.
Đăng ký hàng tháng bắt đầu từ £ 58.
Phân tích giá EURJPY - Ngày 31 tháng XNUMX
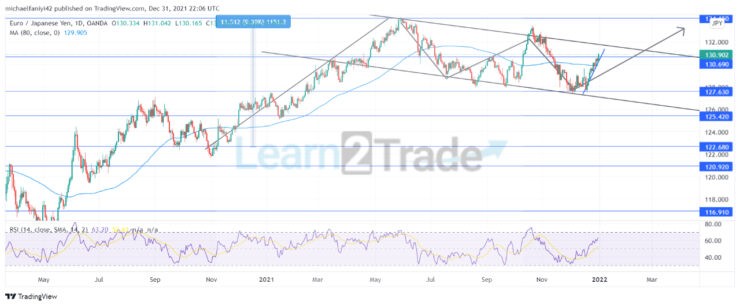
EURJPY is expected to explode in an upward direction after it conforms to a bullish flag pattern. Before the flag sheet began to form, the flag pole’s length had reached the 134.150 resistance level. Price can be seen undulating downwards through a channel. In doing so, it has violated the next key level at 130.690. The market is now resting on a lower key level at 127.630 and has rallied from this point upward.
EURJPY Key Levels
Mức kháng cự: 134.150, 130.690
Mức hỗ trợ: 116.910 USD, 127.630
 Xu hướng dài hạn của EURJPY: Tăng
 Xu hướng dài hạn của EURJPY: Tăng
The turning point for the buyers is at $116.910. The market began to be bullish from here, immediately ascending above 122.680 before it dropped in a retracement. It lifted again and dropped in retracement around 122.680. Afterward, the market surged up to create the flag pole in the flag formation. The flag pole accounts for over 9% of the increase in the market, and liquidity is expected to flow even higher.
The flag pole is formed first, and then the flag sheet is also formed below the 134.150 resistance level. The MA period 80 (Moving Average) is acting as a support for the market by combining with the 127.630. At the current round of undulation, EURJPY is expected to break out of the flag pattern. A bullish engulfment candlestick is a testament to this. The Relative Strength Index (RSI) shows a strong bullish market move as its line surges past midlevel towards the overbought level.
EURJPY Short Term Trend: Bullish
 EURJPY Short Term Trend: Bullish
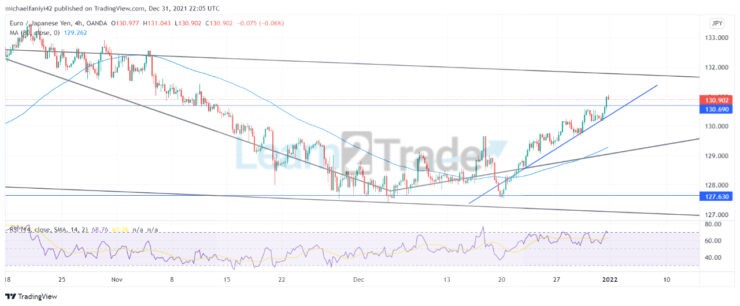
On the 4-hour chart, the market is very much bullish as it bounces up a trendline. The MA period remains below the candlesticks, providing necessary support. The RSI indicator is showing the price in a bullish region and hovering just below the overbought region as the market pulls back and bursts upward at intervals.
Bạn có thể mua tiền điện tử tại đây: Mua tiền xu
Lưu ý: learning2.trade không phải là một cố vấn tài chính. Thực hiện nghiên cứu của bạn trước khi đầu tư tiền của bạn vào bất kỳ tài sản tài chính hoặc sản phẩm hoặc sự kiện được trình bày. Chúng tôi không chịu trách nhiệm về kết quả đầu tư của bạn.
- Môi giới
- Min Tiền gửi
- Điểm số
- Ghé thăm môi giới

- Nền tảng giao dịch tiền điện tử từng đoạt giải thưởng
- 100 đô la tiền gửi tối thiểu,
- FCA & Cysec quy định

- 20% tiền thưởng chào mừng lên đến $ 10,000
- Ký quỹ tối thiểu $ 100
- Xác minh tài khoản của bạn trước khi tiền thưởng được ghi có

- Tài khoản Fund Moneta Markets với tối thiểu $ 250
- Chọn sử dụng biểu mẫu để nhận 50% tiền thưởng tiền gửi của bạn