
Dịch vụ sao chép giao dịch. Algo của chúng tôi tự động mở và đóng giao dịch.
Thuật toán L2T cung cấp các tín hiệu có lợi nhuận cao với rủi ro tối thiểu.
Giao dịch tiền điện tử 24/7. Trong khi bạn ngủ, chúng tôi giao dịch.
Thiết lập 10 phút với những lợi thế đáng kể. Sách hướng dẫn được cung cấp khi mua hàng.
79% Tỷ lệ thành công. kết quả của chúng tôi sẽ kích thích bạn.
Lên đến 70 giao dịch mỗi tháng. Có hơn 5 cặp có sẵn.
Đăng ký hàng tháng bắt đầu từ £ 58.
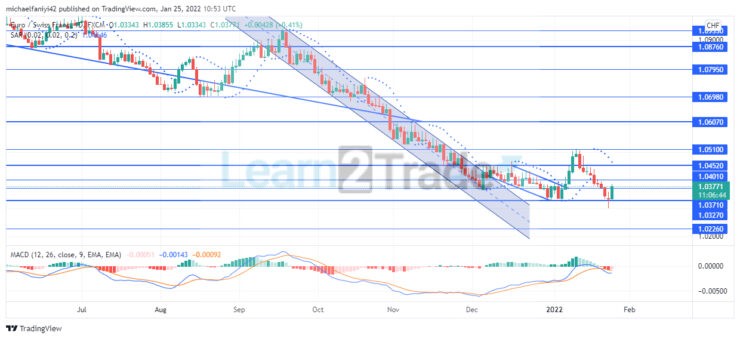
EURCHF Price Analysis – January 25, 2022
EURCHF reverts to 1.03270 as selling pressure negates bullish strength. After the price broke out of the long-drawn descending channel, it met resistance at 1.04520 and then undulated through another descending channel to 1.03270. From here, the bulls switched and powered the market through several key levels. However, at 1.05100, bullish steam was exhausted, and EURCHF reverts to the support level.
Các mức quan trọng của EURCHF
Mức kháng cự: 1.08760, 1.06070, 1.05100
Mức hỗ trợ: 1.02260, 1.03270, 1.03710
 Xu hướng dài hạn của EURCHF: Thay đổi
 Xu hướng dài hạn của EURCHF: Thay đổi
A long-drawn bearish regime has encapsulated the market since the first quarter of March 2022. This was interrupted as market bulls sought to overthrow the bearish regime. A brief period of market turbulence ensued, which was halted at 1.09330. Then market bearishness resumed with full force. Buyers can still be noticed trying to revive at some key levels in the market, but bearish strength prevailed, at least till the 1.03270 support level.
A bullish move finally caught up with the bears and halted the slump in the market, but an immediate resurgence was cut short at 1.04520. A second trial broke through the level but has now been halted at 1.05100. The price, therefore, reverts to 1.03270. Bulls aren’t giving up yet, and the latest daily candle is a strong bullish one. The MACD (Moving Average Convergence Divergence) has yet to fully confirm a resurgence having crossed downward. However, the bearish histogram bars are shrinking.
Xu hướng ngắn hạn của EURCHF: Tăng
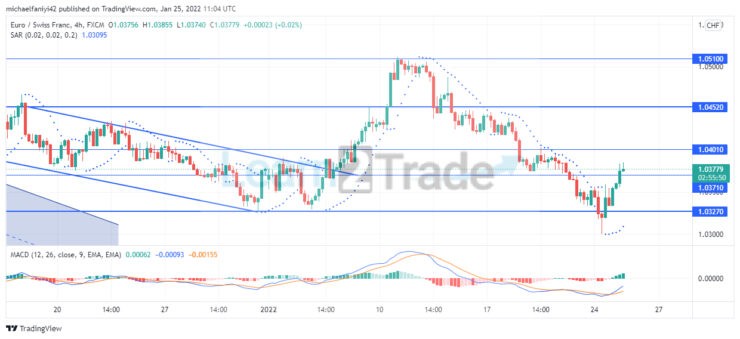 Xu hướng ngắn hạn của EURCHF: Tăng
The market is strongly bullish on the 4-hour chart. The Parabolic SAR (Stop and Reverse) has aligned several dots below the candlesticks. There is now a cross of the MACD lines from below the zero level. Bullish histogram bars have been formed. The market is therefore on the rise again after recovering from the support level. Price will attempt to re-attain and then surpass its previous fall level of 1.05100.
Bạn có thể mua tiền điện tử tại đây: Mua tiền xu
Lưu ý: learning2.trade không phải là một cố vấn tài chính. Thực hiện nghiên cứu của bạn trước khi đầu tư tiền của bạn vào bất kỳ tài sản tài chính hoặc sản phẩm hoặc sự kiện được trình bày. Chúng tôi không chịu trách nhiệm về kết quả đầu tư của bạn.
- Môi giới
- Min Tiền gửi
- Điểm số
- Ghé thăm môi giới

- Nền tảng giao dịch tiền điện tử từng đoạt giải thưởng
- 100 đô la tiền gửi tối thiểu,
- FCA & Cysec quy định

- 20% tiền thưởng chào mừng lên đến $ 10,000
- Ký quỹ tối thiểu $ 100
- Xác minh tài khoản của bạn trước khi tiền thưởng được ghi có

- Tài khoản Fund Moneta Markets với tối thiểu $ 250
- Chọn sử dụng biểu mẫu để nhận 50% tiền thưởng tiền gửi của bạn