
Dịch vụ sao chép giao dịch. Algo của chúng tôi tự động mở và đóng giao dịch.
Thuật toán L2T cung cấp các tín hiệu có lợi nhuận cao với rủi ro tối thiểu.
Giao dịch tiền điện tử 24/7. Trong khi bạn ngủ, chúng tôi giao dịch.
Thiết lập 10 phút với những lợi thế đáng kể. Sách hướng dẫn được cung cấp khi mua hàng.
79% Tỷ lệ thành công. kết quả của chúng tôi sẽ kích thích bạn.
Lên đến 70 giao dịch mỗi tháng. Có hơn 5 cặp có sẵn.
Đăng ký hàng tháng bắt đầu từ £ 58.
Phân tích giá BNBUSD - ngày 26 tháng XNUMX
A breakdown at the $196 level by the bears may lead to the declination of the price to $142 level in which further decrease will drop the price to $117. The continuation of the bears defending the $196 support level may push up the price to the resistance level at $254; above the level is $311 and $364 resistance level.
Thị trường BNB / USD
Các cấp chính
Mức cung: $ 254, $ 311, $ 364
Mức cầu: $ 196, $ 142, $ 117
Xu hướng dài hạn của BNBUSD: Giảm giá
The coin is conforming to a triangle chart pattern in the daily chart. February 19 was the first time the coin tested the resistance level at $364. The level rejected further increase in price with the formation of strong bearish candle. The price decline to $254 level. Today, February 26 the support level at $196 has been tested when the coin is pulling back from the resistance level at $254.
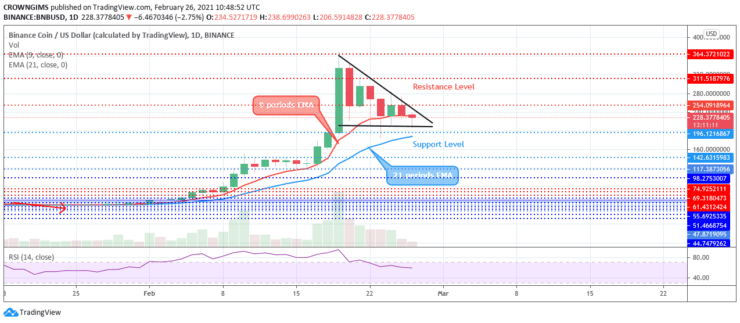
BNB is testing the support level at $196 as at the time of writing this report. A breakdown at the $196 level by the bears may lead to the declination of the price to $142 level in which further decrease will drop the price to $117. The continuation of the bears defending the $196 support level may push up the price to the resistance level at $254; above the level is $311 and $364 resistance level. The relative index indicator period 14 is at 60 levels with the signal line pointing down which connotes sell signal.
Xu hướng trung hạn của BNBUSD: Giảm
BNB is bearish in the 4-hour chart. The price action has formed a triangle chart pattern in the 4-hour chart. Yesterday at the early market period, the price was in the ranging movement at $254 price level. The sellers later prevail and the price dropped towards the support level at $196. It seems the price may breakout at the lower trend line of the triangle which may leads to further price reduction.
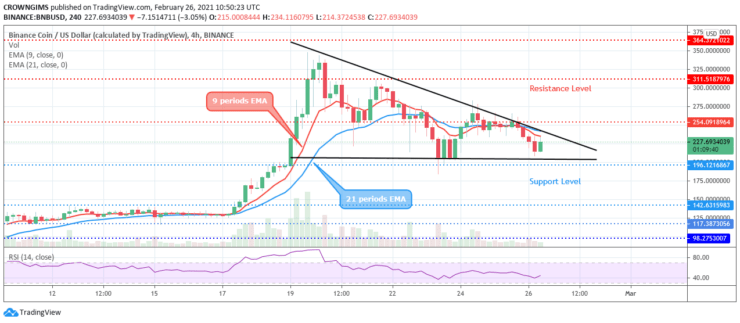
The price is awaiting a breakout from the triangle formed. The price is trading below the 9 periods EMA and 21 periods EMA. The relative strength index period 14 is exhibiting buy signal at 40 levels.
- Môi giới
- Min Tiền gửi
- Điểm số
- Ghé thăm môi giới

- Nền tảng giao dịch tiền điện tử từng đoạt giải thưởng
- 100 đô la tiền gửi tối thiểu,
- FCA & Cysec quy định

- 20% tiền thưởng chào mừng lên đến $ 10,000
- Ký quỹ tối thiểu $ 100
- Xác minh tài khoản của bạn trước khi tiền thưởng được ghi có

- Tài khoản Fund Moneta Markets với tối thiểu $ 250
- Chọn sử dụng biểu mẫu để nhận 50% tiền thưởng tiền gửi của bạn