
Dịch vụ sao chép giao dịch. Algo của chúng tôi tự động mở và đóng giao dịch.
Thuật toán L2T cung cấp các tín hiệu có lợi nhuận cao với rủi ro tối thiểu.
Giao dịch tiền điện tử 24/7. Trong khi bạn ngủ, chúng tôi giao dịch.
Thiết lập 10 phút với những lợi thế đáng kể. Sách hướng dẫn được cung cấp khi mua hàng.
79% Tỷ lệ thành công. kết quả của chúng tôi sẽ kích thích bạn.
Lên đến 70 giao dịch mỗi tháng. Có hơn 5 cặp có sẵn.
Đăng ký hàng tháng bắt đầu từ £ 58.
Phân tích giá BNBUSD - ngày 22 tháng XNUMX
An increase in the sellers’ pressure may push the price below the support level of $36 and the daily candlestick may close below the level, the price will decline further to test the $31 and $27 support level. Inability to break down the support level of $36, the bullish trend may continue to target the resistance levels at $41, $44, and $48.
Thị trường GBP / JPY
Các cấp chính
Mức cung: $ 41, $ 44, $ 48
Mức cầu: $ 36, $ 31, $ 27
BNBUSD Xu hướng dài hạn: Giảm
BNBUSD is bearish in the daily chart. The price soars towards the resistance level of $44 after it breaks up the resistance levels of $37 and $41. The price pulled back to retest the broken level of $31. The bulls increased the price and the resistance level of $44 is tested a second time but unable to penetrate the level. The bears are taken over the BNBUSD market as the bearish candles are forming.
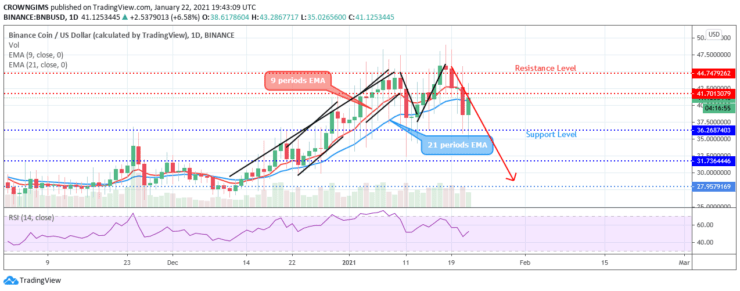
The price has penetrated the dynamic support levels of 21 periods EMA and the 9 periods EMA downside and the coin is trading below the two EMAs which connotes the gradual increase of the bears’ momentum. The Relative Strength Index period 14 is at 50 levels with the signal lines pointing up to indicate a buy signal which may be a pullback. An increase in the sellers’ pressure may push the price below the support level of $36 and the daily candlestick may close below the level, the price will decline further to test the $31 and $27 support level. Inability to break down the support level of $36, the bullish trend may continue to target the resistance levels at $41, $44, and $48.
Xu hướng trung hạn của BNBUSD: Giảm
The bulls’ momentum is gradually increasing in the BNBUSD market and the bears’ pressure is decreasing in the 4-hour chart. Last week. The coin tested the support level of $36 at the early stage of today’s market. A pin bar candle pattern is formed and the price started increasing towards the $41 price level.
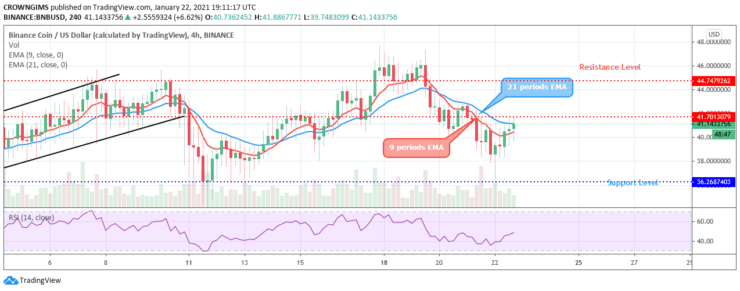
The 9 periods EMA is trying to cross the 21 periods EMA upside while the coin is trading above the two EMAs which connotes an increase in the bulls’ momentum. The RSI indicator period 14 is above 40 levels and the signal lines bending up to indicate a buy signal.
- Môi giới
- Min Tiền gửi
- Điểm số
- Ghé thăm môi giới

- Nền tảng giao dịch tiền điện tử từng đoạt giải thưởng
- 100 đô la tiền gửi tối thiểu,
- FCA & Cysec quy định

- 20% tiền thưởng chào mừng lên đến $ 10,000
- Ký quỹ tối thiểu $ 100
- Xác minh tài khoản của bạn trước khi tiền thưởng được ghi có

- Tài khoản Fund Moneta Markets với tối thiểu $ 250
- Chọn sử dụng biểu mẫu để nhận 50% tiền thưởng tiền gửi của bạn