
Service for copy trading. Our Algo automatically opens and closes trades.
The L2T Algo provides highly profitable signals with minimal risk.
24/7 cryptocurrency trading. While you sleep, we trade.
10 minute setup with substantial advantages. The manual is provided with the purchase.
79% Success rate. Our outcomes will excite you.
Up to 70 trades per month. There are more than 5 pairs available.
Monthly subscriptions begin at £58.
Key Resistance Zones: 28500, 29000, 29500
Key Support Zones: 26000, 25500, 25000
US Wall Street 30 (US30USD) Long-term Trends: Bearish
The index is currently falling after reaching the overbought region. It rose to a high of 27583 and was resisted. A correction candle body tested the Fibonacci 0.618 retracement level. It indicates that the index’s first target will be at the 1.618 extension level. Later, the price action will continue.
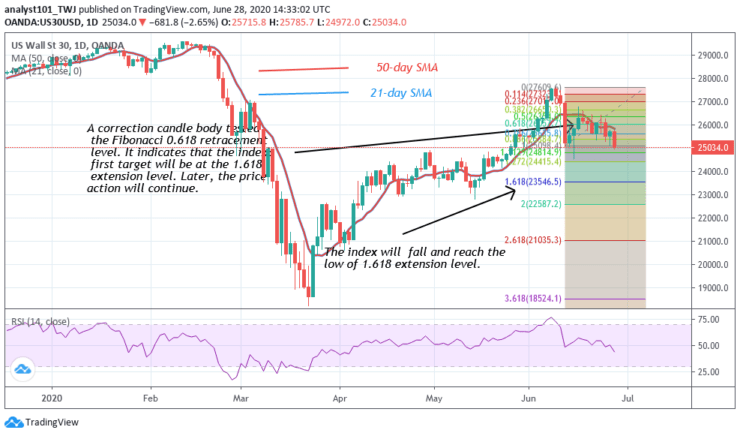
Daily Chart Indicators Reading:
The 21-day SMA and the 50-day SMA are sloping in a downward move. The price has fallen to level 44 of the Relative Strength Index period 14. It indicates that the index is in the downtrend zone and below the centerline 50.
US Wall Street 30 (US30USD) Medium-term Trend: Bullish
On the 4-hour chart, the index is falling. The market is on a downward move after retesting the resistance at level 26400. The selling pressure is likely to persist as the bears break the trend line. The index will fall to level 1.618 Fibonacci extension level.
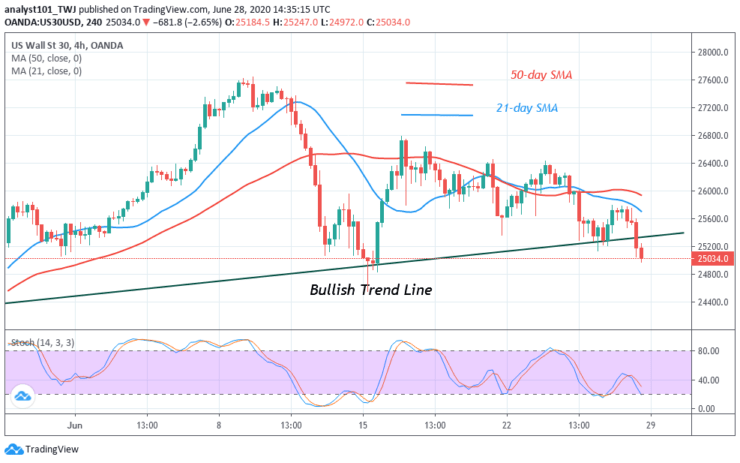
4-hour Chart Indicators Reading
US30USD is now below 40% range of the daily stochastic. It indicates that the market is in the bearish momentum. The SMAs are still sloping downward. The price has broken the trend line and closes below it. The implication is that the downtrend is ongoing.
General Outlook for US Wall Street 30 (US30USD)
US30USD index is in a downtrend. The index is heading to the level 1.618 Fibonacci retracement level. In other words, US30USD will reach a low of 23560’
Note: Learn2Trade.com is not a financial advisor. Do your research before investing your funds in any financial asset or presented product or event. We are not responsible for your investing results
- Broker
- Min Deposit
- Score
- Visit Broker

- Award-winning Cryptocurrency trading platform
- $100 minimum deposit,
- FCA & Cysec regulated

- 20% welcome bonus of upto $10,000
- Minimum deposit $100
- Verify your account before the bonus is credited

- Over 100 different financial products
- Invest from as little as $10
- Same-day withdrawal is possible
- Fund Moneta Markets account with a minimum of $250
- Opt in using the form to claim your 50% deposit bonus