
Kopya ticareti için hizmet. Algo'muz işlemleri otomatik olarak açar ve kapatır.
L2T Algo, minimum riskle oldukça karlı sinyaller sağlar.
24/7 kripto para ticareti. Siz uyurken biz ticaret yaparız.
Önemli avantajlarla 10 dakikalık kurulum. Kılavuz, satın alma işlemiyle birlikte verilir.
%79 Başarı oranı. Sonuçlarımız sizi heyecanlandıracak.
Ayda en fazla 70 işlem. 5'ten fazla çift mevcuttur.
Aylık abonelikler £ 58'den başlar.
NEO Fiyat Analizi – 09 Kasım
When the bulls push up the price to break up the two dynamic resistance levels, the bulls may likely break up the resistance level of $16 and expose the price to $19 and $22 price level. In case the dynamic resistance levels hold the price, bearish momentum may continue towards the support level of $13, $12, and $9.
NEO / USD Pazarı
Anahtar Seviyeleri:
Direnç seviyeleri: $ 16, $ 19, $ 22
Destek seviyeleri: $ 13, $ 12, $ 9
NEO / USD Uzun Vadeli Trend - Düşüş
NEOUSD is bearish in the daily chart. The bears are still in control of NEO market since 23 October. The coin has reduced to the support level of $13 after it penetrates the support level of $14. Last week, it seems the bearish pressure is getting weak and the bulls’ momentum is not strong enough to push up the price. The price is trying to break up the dynamic resistance level but unable till the period of written this report.
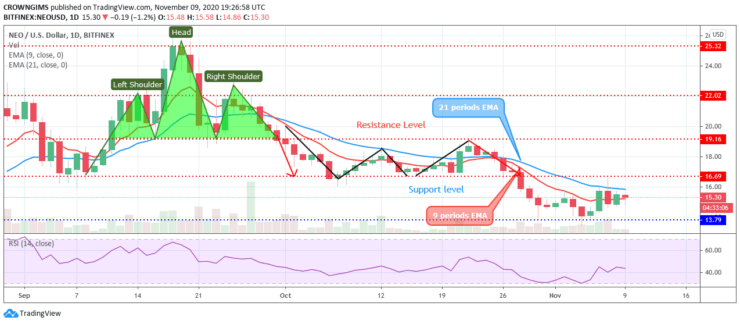
The price is consolidating below and in between the 9 periods EMA and 21 periods EMA which indicates that the momentum of the bears and bulls’ momentum is at equilibrium. When the bulls push up the price to break up the two dynamic resistance levels, the bulls may likely break up the resistance level of $16 and expose the price to $19 and $22 price level. In case the dynamic resistance levels hold the price, bearish momentum may continue towards the support level of $13, $12, and $9. The relative strength index period 14 is bending down at 40 levels to indicate a sell signal.
NEO/USD Orta Vadeli Trend – Düşüş
NEO is bearish in the medium-term outlook; the price found support at $13 on November 04. The same day, a bullish engulfing candle pattern emerges and the price increases to test the resistance level of $16. The bears defend the just mentioned resistance level and the price pulls back and began consolidation.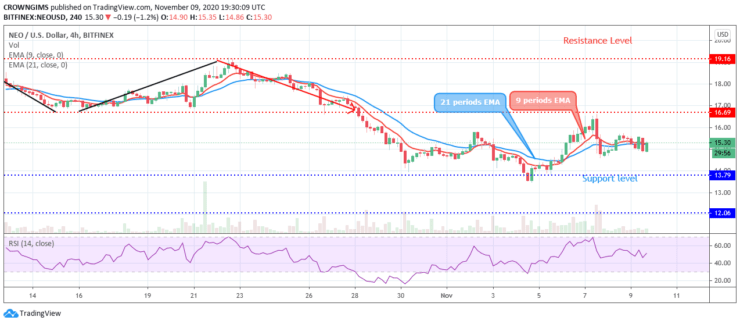
The 9 periods EMA is interlocking to the 21 periods EMA while the price is trading over and around the two EMAs. The relative strength index period 14 is not displaying a specific direction which indicates that consolidation is in progress.
- komisyoncu
- Min Mevduat
- Puan
- Broker'ı ziyaret et

- Ödüllü Cryptocurrency ticaret platformu
- Minimum 100 $ depozito,
- FCA ve Cysec düzenlenmiştir

- 20 $ 'a kadar% 10,000 hoşgeldin bonusu
- Minimum para yatırma miktarı $ 100
- Bonus yatırılmadan önce hesabınızı doğrulayın

- 100'den fazla farklı finansal ürün
- 10 $ 'a kadar yatırım yapın
- Aynı gün para çekme mümkündür
- Minimum 250$ ile Moneta Markets hesabına para yatırın
- % 50 para yatırma bonusunuzu talep etmek için formu kullanmayı seçin