
Kopya ticareti için hizmet. Algo'muz işlemleri otomatik olarak açar ve kapatır.
L2T Algo, minimum riskle oldukça karlı sinyaller sağlar.
24/7 kripto para ticareti. Siz uyurken biz ticaret yaparız.
Önemli avantajlarla 10 dakikalık kurulum. Kılavuz, satın alma işlemiyle birlikte verilir.
%79 Başarı oranı. Sonuçlarımız sizi heyecanlandıracak.
Ayda en fazla 70 işlem. 5'ten fazla çift mevcuttur.
Aylık abonelikler £ 58'den başlar.
NZDUSD Fiyat Analizi – 2 Aralık
NZDUSD bears prepare for a downpour in the market. The bears are prepared to rage a storm of influence on the market by moving prices with strong, significant strength. The market will experience a downpour due to the bears’ successful gain in power over the bulls in the market. The bulls want to lift the price movement upward to break through the 0.68430 key level. However, due to the low level of impact, the bears will eventually succeed in returning price movement downward in a bearish torrent.
NZDUSD Temel Seviyeleri:
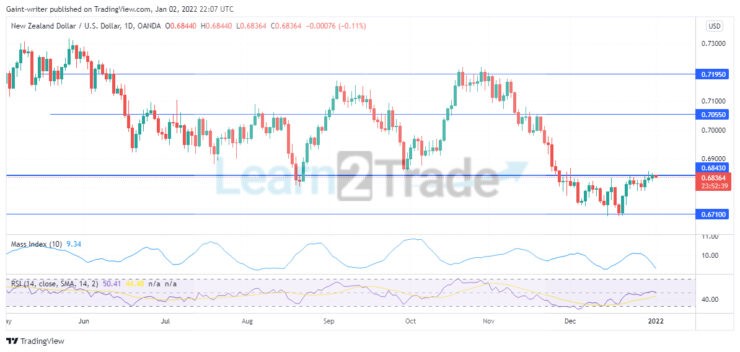
Direnç Anahtar Seviyeleri: 0.71950, 0.70550
Destek Anahtar Seviyeleri: 0.68430, 0.67100
 NZDUSD Uzun Vadeli Trend: Ayı
 NZDUSD Uzun Vadeli Trend: Ayı
The NZDUSD market can be described as having exhibited a wayward influence in the sense that the market gave both the buyers and the sellers space in the market to manipulate prices in its direction. The market emerged with a bear trend and the bears manipulated the market downward, down to the 0.68430 key level. When the price attained this level, the bulls had a significant impact on the market’s influence. The price level rallied back to the 0.71950 key level. Bull’s torment fell at this significant level of influence. The price level then continues in a side-ways movement.
The bulls and the bears struggled to keep the price structure. The bears eventually zoomed in with a downpour of price movement, breaking several price levels of influence. Price then dropped to several lows before breaking through the 0.68430 key level. The bears strengthen themselves to break through this level to ride to the 0.67100 key level. The bulls, however, tried to entangle the bears to push the price level back to the 0.68430 key level. The RSI (Relative Strength Indicator) shows price movement at the middle level pointing downward as price tends to assume a bearish direction.
NZDUSD Uzun Vadeli Trend: Ayı
 NZDUSD Uzun Vadeli Trend: Ayı
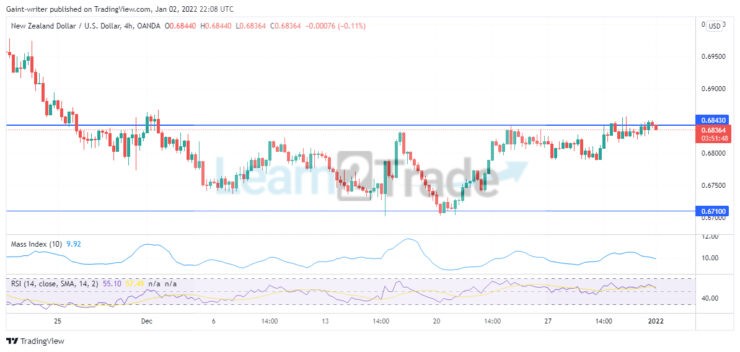
The 4-hour chart price inclination shows the movement to be random and between the price range values of 0.68430 and 0.67100, the key level of influence. The RSI also shows a price signal in the middle level pointing downward, indicating a bearish presence at hand as the market is prepared for a downpour, and the mass flow index indicator also follows the direction of a bearish market. The price level is therefore ready for a downpour below the 0.68430 key level.
Kripto paraları buradan satın alabilirsiniz: Jeton satın alın
Not: öğren2.ticaret mali müşavir değil. Fonlarınızı herhangi bir finansal varlığa veya sunulan ürün veya etkinliğe yatırım yapmadan önce araştırma yapın. Yatırım sonuçlarınızdan biz sorumlu değiliz.
- komisyoncu
- Min Mevduat
- Puan
- Broker'ı ziyaret et

- Ödüllü Cryptocurrency ticaret platformu
- Minimum 100 $ depozito,
- FCA ve Cysec düzenlenmiştir

- 20 $ 'a kadar% 10,000 hoşgeldin bonusu
- Minimum para yatırma miktarı $ 100
- Bonus yatırılmadan önce hesabınızı doğrulayın

- 100'den fazla farklı finansal ürün
- 10 $ 'a kadar yatırım yapın
- Aynı gün para çekme mümkündür
- Minimum 250$ ile Moneta Markets hesabına para yatırın
- % 50 para yatırma bonusunuzu talep etmek için formu kullanmayı seçin