
Kopya ticareti için hizmet. Algo'muz işlemleri otomatik olarak açar ve kapatır.
L2T Algo, minimum riskle oldukça karlı sinyaller sağlar.
24/7 kripto para ticareti. Siz uyurken biz ticaret yaparız.
Önemli avantajlarla 10 dakikalık kurulum. Kılavuz, satın alma işlemiyle birlikte verilir.
%79 Başarı oranı. Sonuçlarımız sizi heyecanlandıracak.
Ayda en fazla 70 işlem. 5'ten fazla çift mevcuttur.
Aylık abonelikler £ 58'den başlar.
EOSUSD Price Analysis – February 11
EOSUSD has reached the high of $4.5 level, should it hold the price, it may bounce and decrease towards the support levels at $3.8, $3.3, and $2.9. In case the resistance level of $4.5 does not hold the price, it will increase further to the resistance levels at $5.2 and $6.4. The Relative Strength Index period 14 is at the overbought level displaying the sell signal.
EOS / USD Uzun Vadeli Trend: Boğa
Direnç seviyeleri: $ 4.5, $ 5.2, $ 6.4
Destek seviyeleri: $ 3.8, $ 3.3, $ 2.9
EOS/USD is bullish on the daily chart; the coin has been ranging for more than a month within $3.8 and $2.7 levels. Several attempts made to break out of the ranging zone failed. On February 07, the bulls gained enough momentum to break up the resistance level of $3.3, and the price increases to $3.8. The bulls pressure increase and break up the resistance level of $3.8, the price is at $4.5 level at the moment.
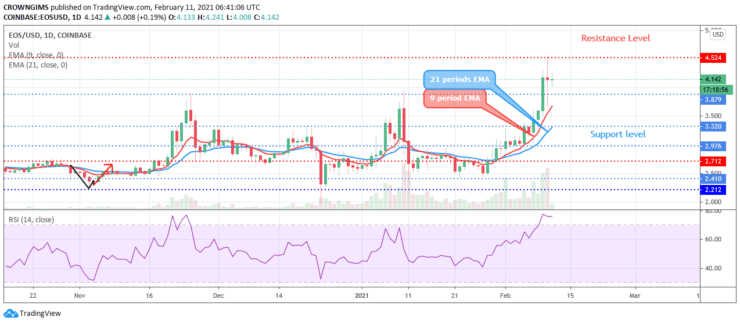
The slow-moving EMA (9 periods) has crossed the fast-moving EMA (21 periods) upside and the price is trading above the two EMAs at a distance to indicate strong bullish pressure. EOSUSD has reached the high of $4.5 level, should it hold the price, it may bounce and decrease towards the support levels at $3.8, $3.3, and $2.9. In case the resistance level of $4.5 does not hold the price, it will increase further to the resistance levels at $5.2 and $6.4. The Relative Strength Index period 14 is at the overbought level displaying the sell signal.
EOS / USD Fiyatı Orta Vadeli Trend: Boğa
The coin is bullish on the medium-term outlook. The pressure of the buyer’s increases and the price break away from the consolidation zone. The former resistance level of $3.3 was penetrated upside. More bullish candles were produced and the price increases to find resistance at the $4.5 price level. The price is currently pulling back.
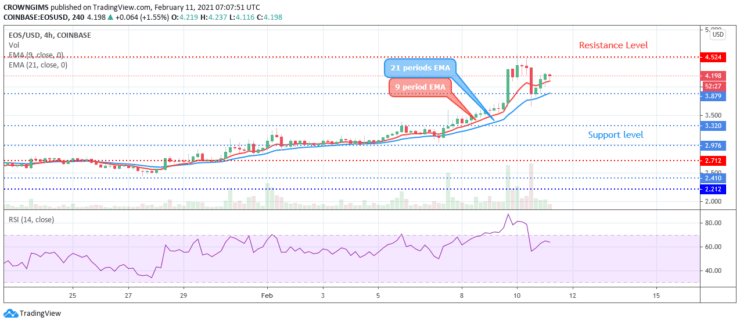
The price is trading above the 9-day EMA and the 21-day EMA is an indication that the bulls are dominating the market. The current price pullback may lead to a bearish price reversal. Meanwhile, the relative strength index period 14 is pointing downside to indicate a sell signal.
- komisyoncu
- Min Mevduat
- Puan
- Broker'ı ziyaret et

- Ödüllü Cryptocurrency ticaret platformu
- Minimum 100 $ depozito,
- FCA ve Cysec düzenlenmiştir

- 20 $ 'a kadar% 10,000 hoşgeldin bonusu
- Minimum para yatırma miktarı $ 100
- Bonus yatırılmadan önce hesabınızı doğrulayın

- 100'den fazla farklı finansal ürün
- 10 $ 'a kadar yatırım yapın
- Aynı gün para çekme mümkündür
- Minimum 250$ ile Moneta Markets hesabına para yatırın
- % 50 para yatırma bonusunuzu talep etmek için formu kullanmayı seçin