
Yatırım yaptığınız tüm parayı kaybetmeye hazır olmadığınız sürece yatırım yapmayın. Bu yüksek riskli bir yatırımdır ve bir şeyler ters giderse korunmanız pek mümkün değildir. Daha fazlasını öğrenmek için 2 dakikanızı ayırın
Kopya ticareti için hizmet. Algo'muz işlemleri otomatik olarak açar ve kapatır.
L2T Algo, minimum riskle oldukça karlı sinyaller sağlar.
24/7 kripto para ticareti. Siz uyurken biz ticaret yaparız.
Önemli avantajlarla 10 dakikalık kurulum. Kılavuz, satın alma işlemiyle birlikte verilir.
%79 Başarı oranı. Sonuçlarımız sizi heyecanlandıracak.
Ayda en fazla 70 işlem. 5'ten fazla çift mevcuttur.
Aylık abonelikler £ 58'den başlar.
Cardano’s price action has bounced off support at $0.3840 to continue its medium-term upside retracement. However, the current price level of this coin lies at the same level as the middle limit of the Bollinger Bands and the Fibonacci Retracement level of 23.60. Other indications from this market suggest that the mentioned level may be broken.
Cardano Analysis Data
ADA Value Now: $0.4097
ADA Market Cap: $14,176,539,388
Cardano Moving Supply: 34,799,728,438
Cardano Total Supply: 35,727,842,285
ADA CoinMarketCap Ranking: 7
Başlıca Fiyat Seviyeleri:
Üst: 0.4097 ABD Doları, 0.4100 ABD Doları ve 0.4130 ABD Doları
Taban: 0.4060 ABD Doları, 0.4020 ABD Doları ve 0.3990 ABD Doları
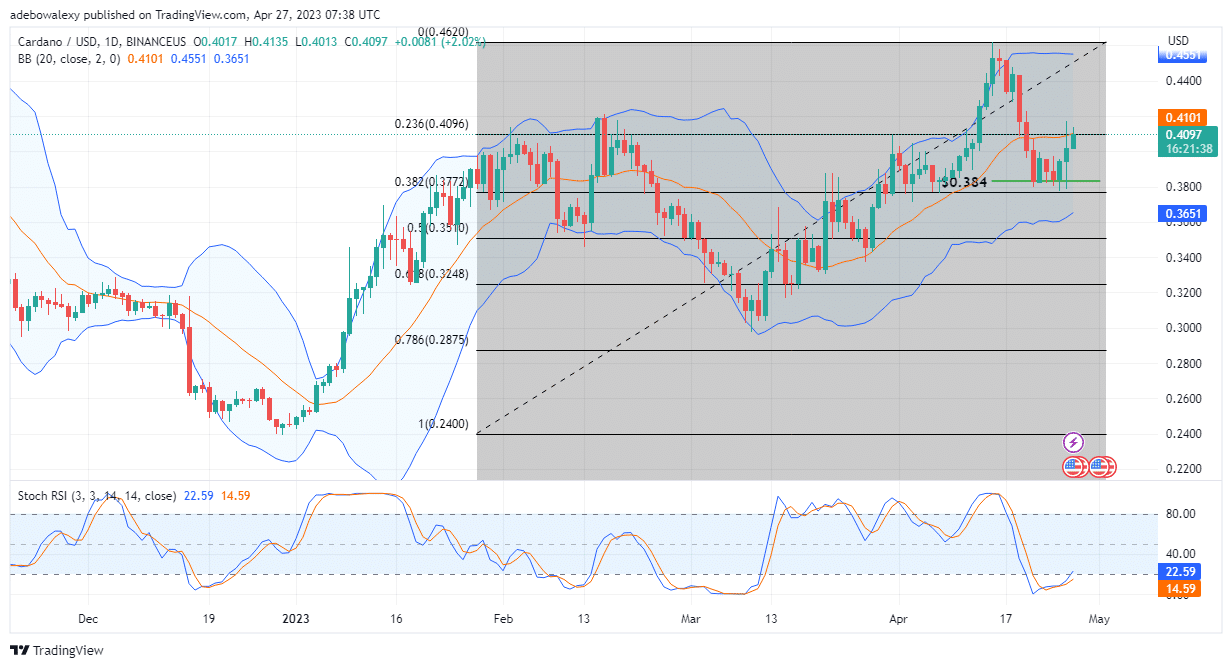
Cardano (ADA) Price Uptrend Resurges
Üzerinde Cardano daily market, it appears that price action has resumed an uptrend in a bid to extend profits. At this point, the last price candle on this chart is now at the point of breaking a technical resistance at the $0.4096 mark. Also, the Relative Strength Index (RSI) curves are now steadily ascending upward and towards the 40 level. In addition, the Bollinger Bands on this chart appear dilated and upwardly projected. Consequently, this supports higher price upside expectations in this market.
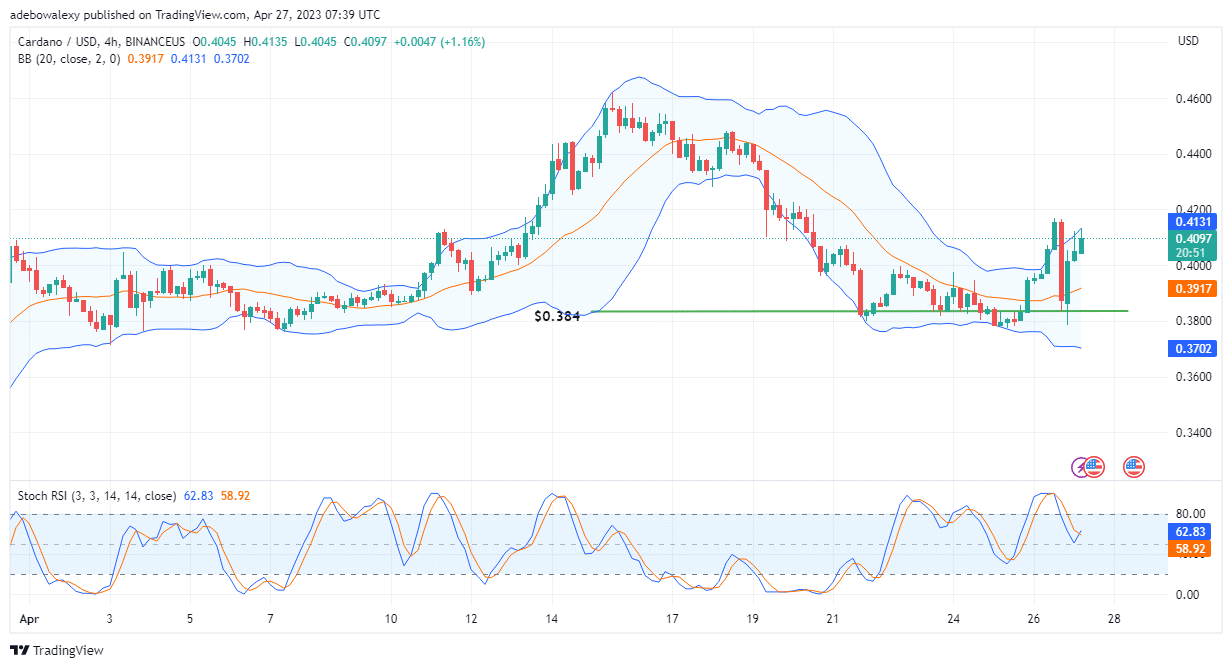
Cardano’s (ADA) Price Action Eyes the $0.4200 Mark
Fiyat hareketleri Cardano 4-hourly market continue to gain upside traction. The appearance of the last price candle on this chart suggests that price action may even rise further in the ongoing session. The wick of this price candle can be seen touching the uppermost limit of the Bollinger Bands indicator. Also, the RSI indicator has given another crossover above level 60 of the indicator. Therefore, more upside thrust is on the way, as the price may climb further towards $0.4200.
- komisyoncu
- Min Mevduat
- Puan
- Broker'ı ziyaret et

- Ödüllü Cryptocurrency ticaret platformu
- Minimum 100 $ depozito,
- FCA ve Cysec düzenlenmiştir

- 20 $ 'a kadar% 10,000 hoşgeldin bonusu
- Minimum para yatırma miktarı $ 100
- Bonus yatırılmadan önce hesabınızı doğrulayın

- 100'den fazla farklı finansal ürün
- 10 $ 'a kadar yatırım yapın
- Aynı gün para çekme mümkündür
- Minimum 250$ ile Moneta Markets hesabına para yatırın
- % 50 para yatırma bonusunuzu talep etmek için formu kullanmayı seçin