
Kopya ticareti için hizmet. Algo'muz işlemleri otomatik olarak açar ve kapatır.
L2T Algo, minimum riskle oldukça karlı sinyaller sağlar.
24/7 kripto para ticareti. Siz uyurken biz ticaret yaparız.
Önemli avantajlarla 10 dakikalık kurulum. Kılavuz, satın alma işlemiyle birlikte verilir.
%79 Başarı oranı. Sonuçlarımız sizi heyecanlandıracak.
Ayda en fazla 70 işlem. 5'ten fazla çift mevcuttur.
Aylık abonelikler £ 58'den başlar.
Bitcoin SV Fiyat Analizi - 05 Nisan
An increase in the buyers’ pressure will further increase the price to $198 and $185 resistance levels. In case the buyers’ pressure could not break up $217 level, the price may face the support levels at $217, $198 and $185.
BSV / USD Pazarı
Anahtar Seviyeleri:
Direnç seviyeleri: $ 233, $ 259, $ 311
Destek seviyeleri: $ 217, $ 198, $ 185
BSV / USD Uzun Vadeli Trend: Boğa
On the daily chart, BSV/USD market is Bullish. On April 01, the buyers gained more pressure and pushed the crypto out of the ranging mode. The buyers aided the price increase to the resistance level of $259 after it broken up the $233 price level. The sellers reacted against the increase with the formation of long and big daily bearish candle. The support level of $217 was retested. At moment, it seems the buyers are regaining their momentum.
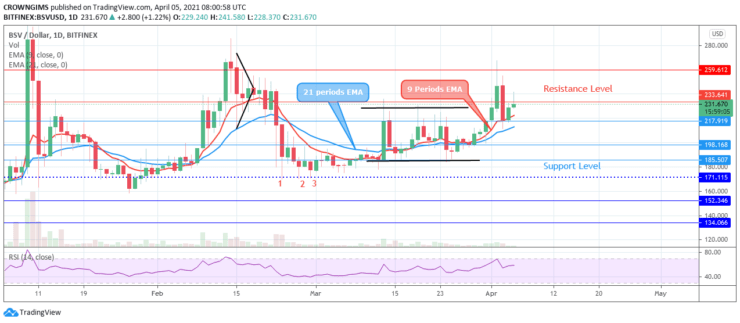
Bitcoin SV is trading at the moment around $233 price level. It is trading above the 9 periods EMA and 21 periods EMA while the two EMAs are well separated which indicate volatility in the Bitcoin SV market. An increase in the buyers’ pressure will further increase the price to $198 and $185 resistance levels. In case the buyers’ pressure could not break up $217 level, the price may face the support levels at $217, $198 and $185.
BSV / USD Orta Vadeli Trend: Boğa
Bitcoin SV is bullish on the medium-term outlook. The coin suddenly increased to test the resistance level at $259 on April 02. The bulls had no momentum to sustain the breakout, bears gain more pressure and push down the coin to retest the $217 level. The bulls defend the just mentioned level and the price resume bullish movement.
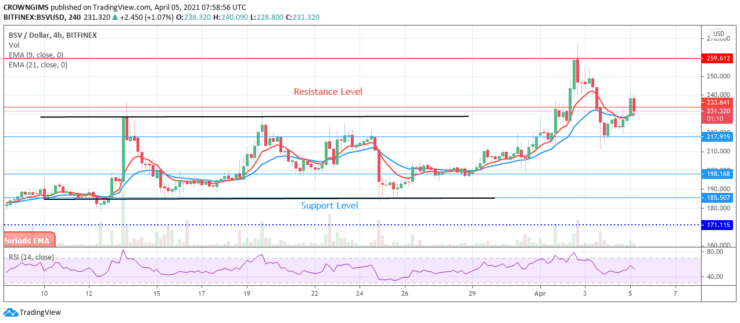
The two EMAs are close to each other and the price is trading above the EMAs which connotes a bullish movement. The relative strength index is displaying a bearish signal above the 40 levels which indicates sell signal which may be a pullback.
- komisyoncu
- Min Mevduat
- Puan
- Broker'ı ziyaret et

- Ödüllü Cryptocurrency ticaret platformu
- Minimum 100 $ depozito,
- FCA ve Cysec düzenlenmiştir

- 20 $ 'a kadar% 10,000 hoşgeldin bonusu
- Minimum para yatırma miktarı $ 100
- Bonus yatırılmadan önce hesabınızı doğrulayın

- 100'den fazla farklı finansal ürün
- 10 $ 'a kadar yatırım yapın
- Aynı gün para çekme mümkündür
- Minimum 250$ ile Moneta Markets hesabına para yatırın
- % 50 para yatırma bonusunuzu talep etmek için formu kullanmayı seçin