
Kopya ticareti için hizmet. Algo'muz işlemleri otomatik olarak açar ve kapatır.
L2T Algo, minimum riskle oldukça karlı sinyaller sağlar.
24/7 kripto para ticareti. Siz uyurken biz ticaret yaparız.
Önemli avantajlarla 10 dakikalık kurulum. Kılavuz, satın alma işlemiyle birlikte verilir.
%79 Başarı oranı. Sonuçlarımız sizi heyecanlandıracak.
Ayda en fazla 70 işlem. 5'ten fazla çift mevcuttur.
Aylık abonelikler £ 58'den başlar.
Bitcoin SV Fiyat Analizi - 19 Nisan
Further increase in the bears’ momentum may push down the coin to $285 level, which may decrease the price to $259 and $233 support level. In case the bulls oppose the bears’ pressure and the price is rejected at $285, the bulls may take over the market.
BSV / USD Pazarı
Anahtar Seviyeleri:
Direnç seviyeleri: $ 311, $ 364, $ 440
Destek seviyeleri: 285 $, 259 $, 233 $
BSV / USD Uzun Vadeli Trend: Düşüş
Bitcoin SV is Bearish on the daily chart. The crypto was under the buyers’ control last week. The buyers’ pressure has push the coin to the resistance level of $488. The bulls’ momentum could not penetrate the mentioned level when the bears defends the level. Strong bearish candles emerges at the resistance level of $440, the price decline towards the support level at $285 after breaking down the $364 and $311 level.
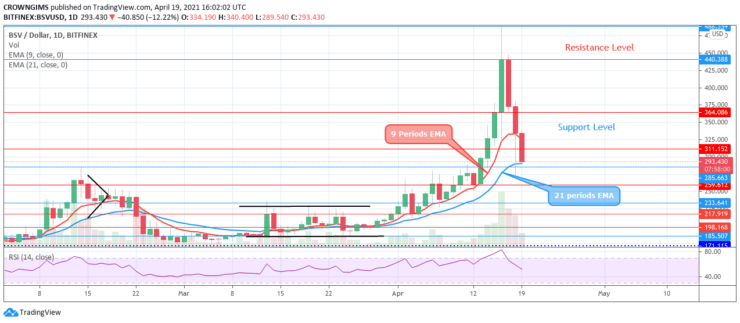
Bitcoin SV is penetrating the dynamic support resistance levels and the price is currently trading between the 9 periods EMA and 21 periods EMA which indicate that bears’ pressure is increasing. Further increase in the bears’ momentum may push down the coin to $285 level, which may decrease the price to $259 and $233 support level. In case the bulls oppose the bears’ pressure and the price is rejected at $285, the bulls may take over the market. However, the relative strength index period 14 is at 50 level bending down to indicate sell signal.
BSV / USD Orta Vadeli Trend: Düşüş
Bitcoin SV is bearish on the medium-term outlook. The high of $488 level was reached on April 16 with a strong bullish candle. The bears defended the mentioned level and the bullish candle turned to an inverted pin bar; this is a bearish signal. The price declines to $311 price level with a strong momentum. The support levels of $364 and $311 has been penetrated downside. The price is currently at $285 price level.
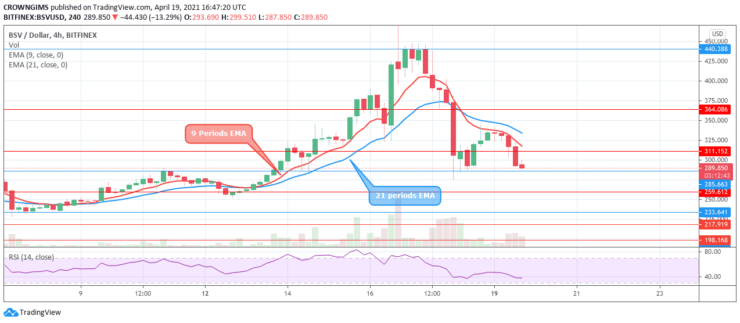
The two EMAs are separated from each other and the price is trading below the EMAs which connotes a strong bearish movement. The relative strength index is displaying a bearish signal at the 40 levels which indicates further reduction in price.
- komisyoncu
- Min Mevduat
- Puan
- Broker'ı ziyaret et

- Ödüllü Cryptocurrency ticaret platformu
- Minimum 100 $ depozito,
- FCA ve Cysec düzenlenmiştir

- 20 $ 'a kadar% 10,000 hoşgeldin bonusu
- Minimum para yatırma miktarı $ 100
- Bonus yatırılmadan önce hesabınızı doğrulayın

- 100'den fazla farklı finansal ürün
- 10 $ 'a kadar yatırım yapın
- Aynı gün para çekme mümkündür
- Minimum 250$ ile Moneta Markets hesabına para yatırın
- % 50 para yatırma bonusunuzu talep etmek için formu kullanmayı seçin