
Kopya ticareti için hizmet. Algo'muz işlemleri otomatik olarak açar ve kapatır.
L2T Algo, minimum riskle oldukça karlı sinyaller sağlar.
24/7 kripto para ticareti. Siz uyurken biz ticaret yaparız.
Önemli avantajlarla 10 dakikalık kurulum. Kılavuz, satın alma işlemiyle birlikte verilir.
%79 Başarı oranı. Sonuçlarımız sizi heyecanlandıracak.
Ayda en fazla 70 işlem. 5'ten fazla çift mevcuttur.
Aylık abonelikler £ 58'den başlar.
Bitcoin (BTC) Fiyat Analizi: Günlük Grafik – Nötr
Temel direnç seviyeleri: 9600 Dolar, 9800 Dolar, 10000 Dolar, 10350 Dolar
Temel destek seviyeleri: 9200 $, 9000 $, 8820 $, 8500 $
On the daily chart, Bitcoin is following a sideways movement for the past 11 days now. The October 26 price cut at $10350 has made the BTC market to subdue with choppy price actions. Meanwhile, the insignificant volatility is making the trade to stay quiet and calm for a while.
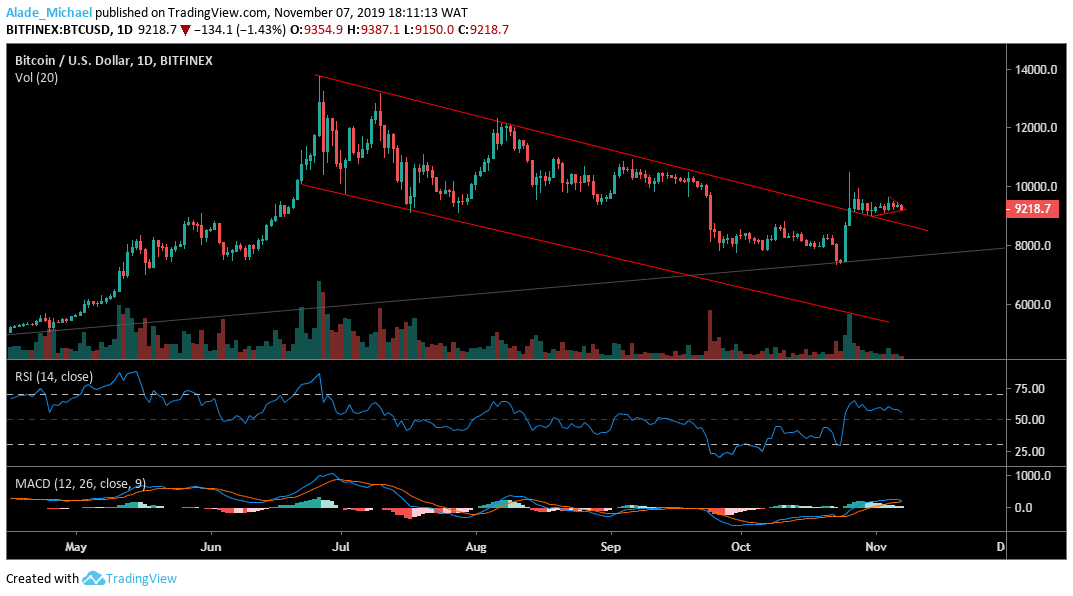
While waiting, Bitcoin’s bullish are still defending the $9000-$8900 support zone, although the market has shown a bearish sign over the past three days now. If the market can stay above the descending channel, Bitcoin may activate a bullish mode to $9800, $10000 and $10350 resistance before testing further resistance. On the downside, a break beneath the $9000 may lead BTC to $8800 and possibly $8500 support.
We can see that the MACD has produced a bullish crossover to show that an incoming bullish momentum. However, the BTC/USD pair is locating support on the RSI mid-band. If the RSI 50 can hold well, we should expect a significant bullish surge to $12000 within a blink of an eye.
Bitcoin (BTC) Fiyat Analizi: Saatlik Grafik - Ayı
Now that Bitcoin has roaming on the triangle’s support, we may now consider the $9100 to be the next Bitcoin trading zone. Since the weekly opening, BTC has been cutting $100 from its daily price. On Monday, Bitcoin traded around $9500, Tuesday $9400, Wednesday $9300 and could probably close below $9200. However, $9000 is still holding as support, followed by $8900 and $8800 on a short-term bearish move.
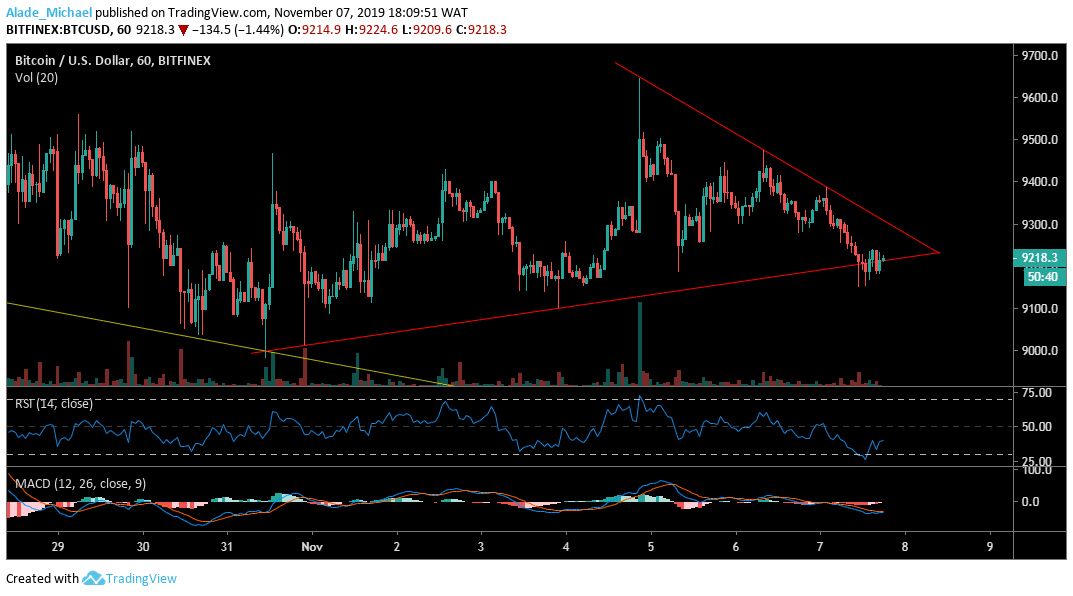
If Bitcoin can hold support well at $9100, we may see a quick recovery to $9300, 9400 and $9500 on the upside. Meanwhile, the RSI is defiantly in a downward position to show a sign of weakness in price. On the MACD indicator, Bitcoin has seen a bearish cross, which suggested that selling pressure is more likely to become heavy in future trading.
- komisyoncu
- Min Mevduat
- Puan
- Broker'ı ziyaret et

- Ödüllü Cryptocurrency ticaret platformu
- Minimum 100 $ depozito,
- FCA ve Cysec düzenlenmiştir

- 20 $ 'a kadar% 10,000 hoşgeldin bonusu
- Minimum para yatırma miktarı $ 100
- Bonus yatırılmadan önce hesabınızı doğrulayın

- 100'den fazla farklı finansal ürün
- 10 $ 'a kadar yatırım yapın
- Aynı gün para çekme mümkündür
- Minimum 250$ ile Moneta Markets hesabına para yatırın
- % 50 para yatırma bonusunuzu talep etmek için formu kullanmayı seçin